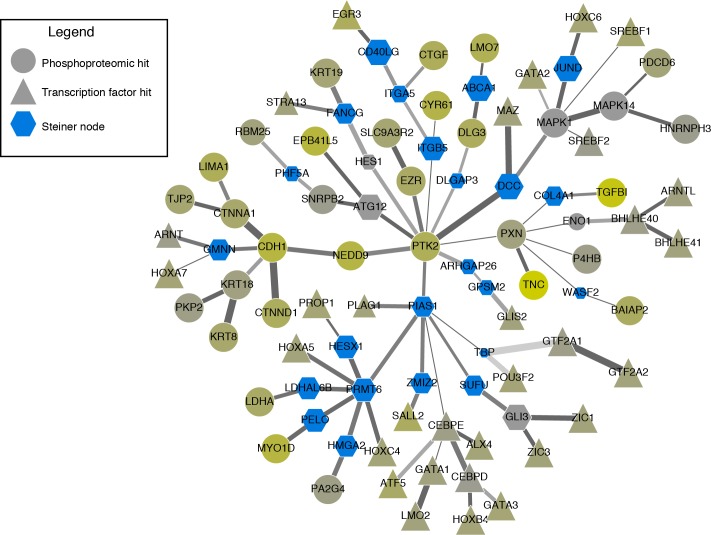
Fig 4. Anticipated results: Network reconstructed from changes in phosphoproteomic measurements (circles) and gene expression measurements (triangles) in lung cancer cell lines stimulated with Tgf-β.
Blue hexagons represent ‘Steiner nodes’ that were not measured as changing in the original experimental measurements but identified through network reconstruction. Nodes that are not blue were measured in the phosphoproteomic data, with color indicating the degree of change in phosphoproteomic measurements: grey indicates no change and yellow indicates a large amount of change. Network robustness was measured by adding noise to the edges using the --noisyEdges flag. The shade of the edge is correlated with the number of times the edge was selected over all perturbations, and the size of a node represents number of times the node was selected. The width of the edge represents the weight assigned to the interaction in the original interactome.

