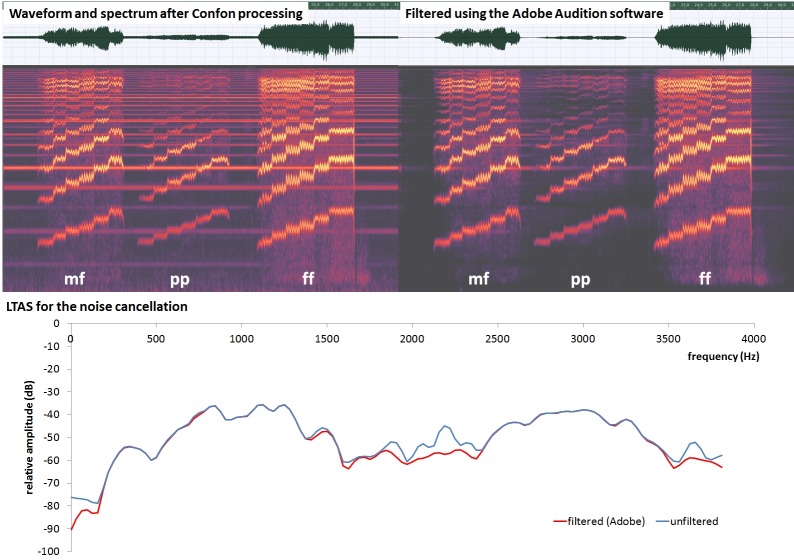
Fig 1. Waveform (upper row) and audio spectrum (middle row) for the file after the first noise cancellation (Confon, left panel) and after the second noise cancellation (Adobe, right panel).
The waveforms include all three loudness tasks (mf = mezzoforte, pp = pianissimo, ff = fortissimo, respectively). The lowest row shows Long Time Average Spectra (LTAS) for both files, after the first noise cancellation (blue) and the second noise cancellation (red), respectively.

