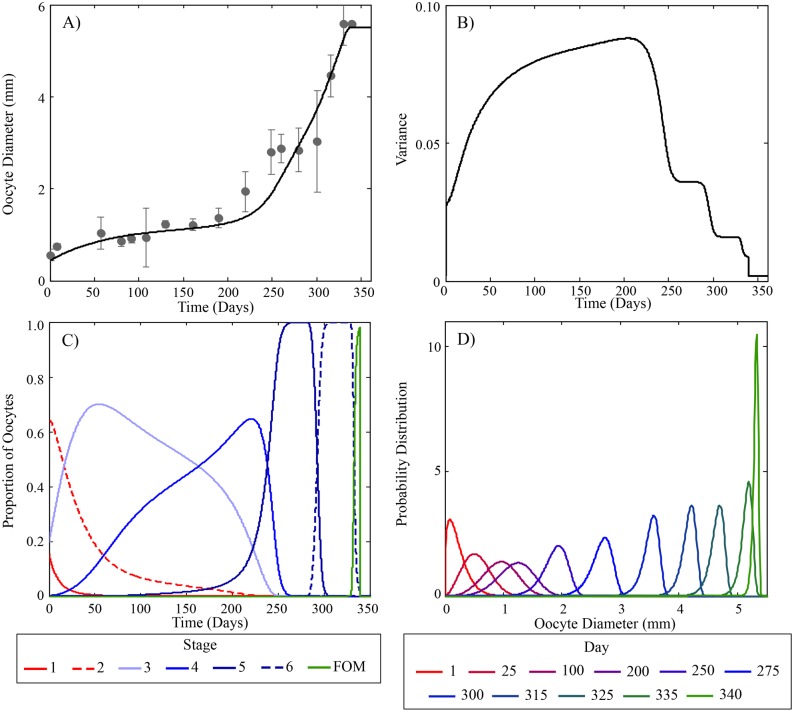
Fig 4. Predicted oocyte growth and staging during a second reproductive cycle in rainbow trout.
(A) Predicted average oocyte growth and experimentally measured values [41]. Measured values were determined from the same individuals used for Figs 2 and 3. (B) Model predicted variance of oocyte diameters. (C) Model predicted proportion and duration of oocyte stages during a second reproductive cycle. Solid and dashed red lines are pre-vitellogenic stages (1 and 2), light to dark blue lines (stages 3–6) are early, mid and late vitellogenic stages and green line is the proportion of oocytes at FOM. (D) Model predictions of the distribution of oocyte diameter at various times during the reproductive cycle. Note the variability of oocyte diameter rapidly increases at the beginning of the cycle and decreases prior to ovulation.

