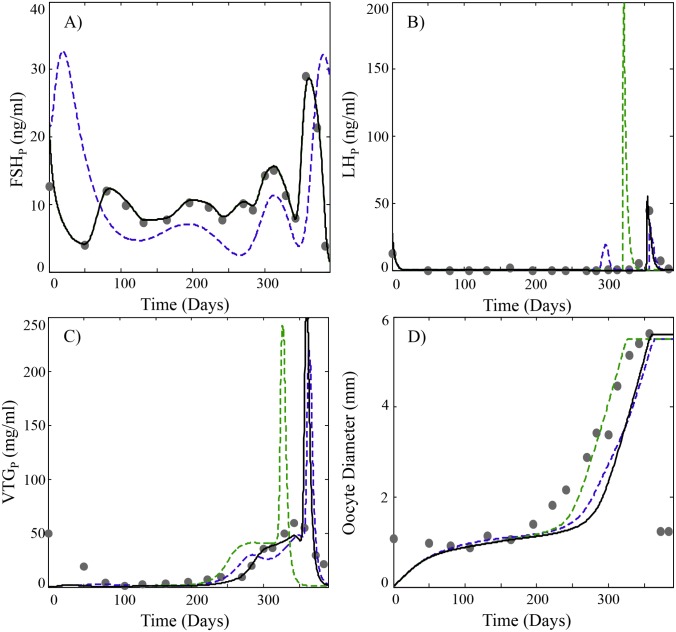
Fig 6. Predicted plasma profiles of (A) FSH, (B) LH, (C) E2 and (D) average oocyte diameter (OAvg) compared to experimental data (black circles) obtained from [53,60].
Model simulations using parameter estimates listed in Table 2 and the same GnRH function used in Figs 2–4 are shown as dashed blue lines. Simulations using a customized GnRH function based on measured FSH levels in [53,60] (see also Appendix S5) are shown as a green dashed line. Simulations with the customized GnRH function and altered vitellogenic staging parameters (s3 = 1.21, s4 = 1.76, s5 = 3.48 and s6 = 5.39) are shown as a black solid line. A regression curve was used to map the GSI data in [53] to the average oocyte diameter (See Appendix S1).

