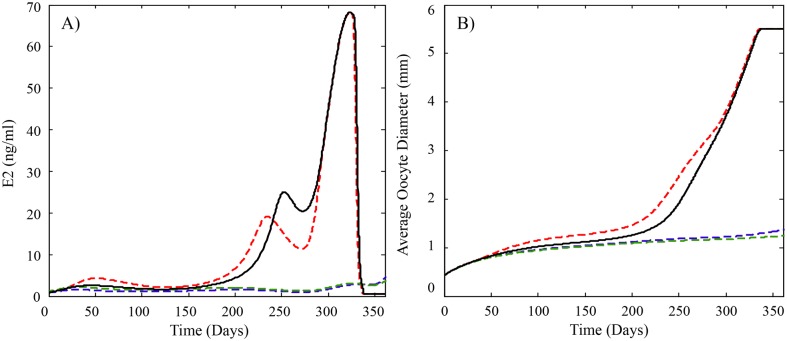
Fig 7. Model predicted profiles of plasma levels of (A) E2 and (B) average oocyte growth for rainbow trout exposed to trenbolone.
Previously published studies suggest trenbolone exposure may decrease E2 synthesis to varying degrees depending on exposure levels, and also increase the clearance of E2 from plasma and increase the secretion of FSH in trout. The solid black line is the model predictions for fish not exposed to trenbolone and uses the parameter values found in Table 2. The dashed lines depict model predictions of known effects of trout that are exposed to trenbolone and use parameter values found in Table 2 except for ClE2,Sj = 0.54*ClE2,Sj for j = 4 and 5, ks,FSH = 4*ks,FSH during Stages 1 and 2. The blue dashed line also uses ClE2 = 1.41*ClE2 and the green dashed line uses ks,mVTG = 0.6*ks,mVTG. The model predicts that ovulation is unlikely to occur when an increase in E2 clearance and/or a decrease in mVTG synthesis is added to the effects because the delay in ovulation is more than 50 days.

