
Figure 1.
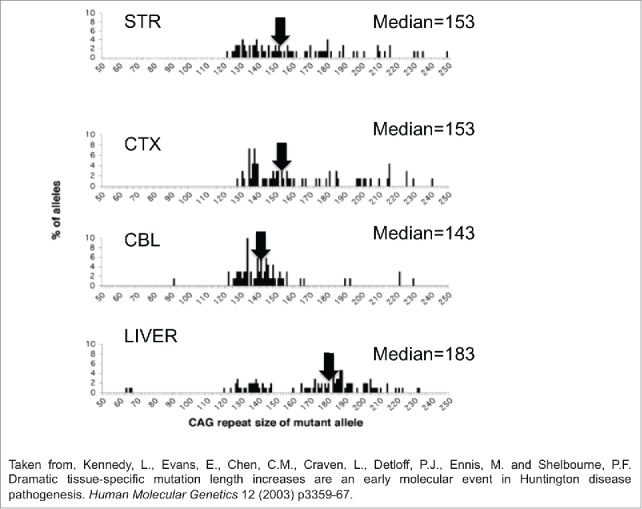
The mutation length distribution within tissues of Hdh(CAG)150 mice at 11 months. The histograms show a representative sample of CAG repeat lengths within the striatum, cortex, cerebellum and liver of an 11-month-old mouse. These data are compiled from small pool PCR analyses of reactions containing only 1–4 Alifiable mutant molecules in a few cells of one animal. The median CAG repeat length and number of mutant alleles (n) examined in each tissue is indicated. STR is striatum, CTX is cortex, CBL is cerebellum. Summing the change in tract length over many animals provides a large n at this particular age group.