
Figure 2.
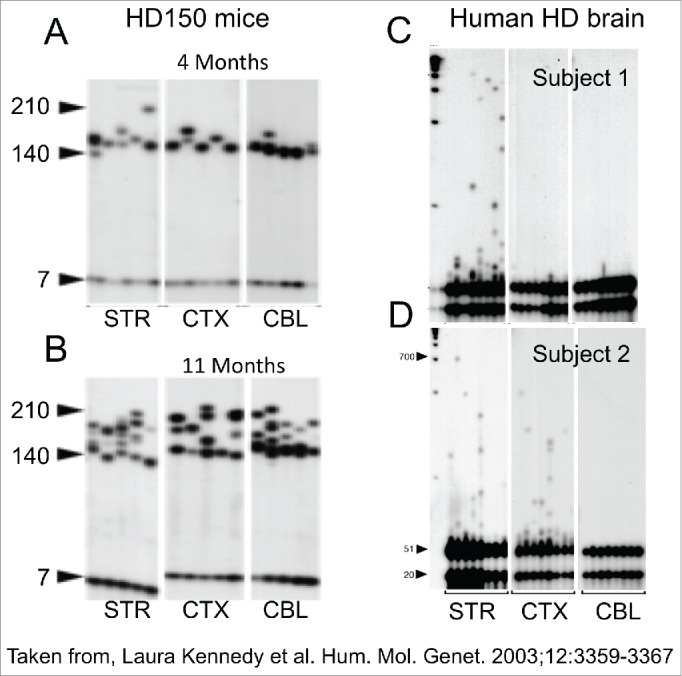
CAG repeat copy number of the progenitor mutation influences tissue-specific mutation length profiles. (A) Representative data from the SP–PCR mutation length profiles within striatum (St), cortex (Cx), cerebellum (Cb) and liver at 4 and 11 months of age in Hdh(Qwt/150) mice. Each lane contains the products from 1 to 10 cells worth of DNA from the tissue indicated. The numbers on the left hand side of the panels indicate the number of CAG repeats carried by the Hdh alleles amplified (mo=months). (B) Dramatic mutation length increases in human HD striata prior to pathological cell loss. Tissue from subject 1 shows mutation length variability in the striatum but not cortex (Brodmann's area 7) or hypothalamus. SP–PCR data reveal that while the median mutation length within tissues is ˜41 CAG repeats, some cells within the striatum contain mutations >1000 CAG repeats in length. Each lane contains the amplification products from ˜50 cells. (C,D) Tissue from subject 2 has mutation length variability in the striatum and cortex (Brodmann's area 7) but not cerebellum. SP–PCR data indicate the median mutation length within both tissues is ˜51 CAG repeats but some striatal cells contain mutations >700 CAG repeats in length. Each lane contains the amplification products from 40 to 50 cells. The numbers on the left side of each panel indicate the number of CAG repeats carried by the HD alleles amplified. The lanes marked M contain the 1Kb plus size marker.