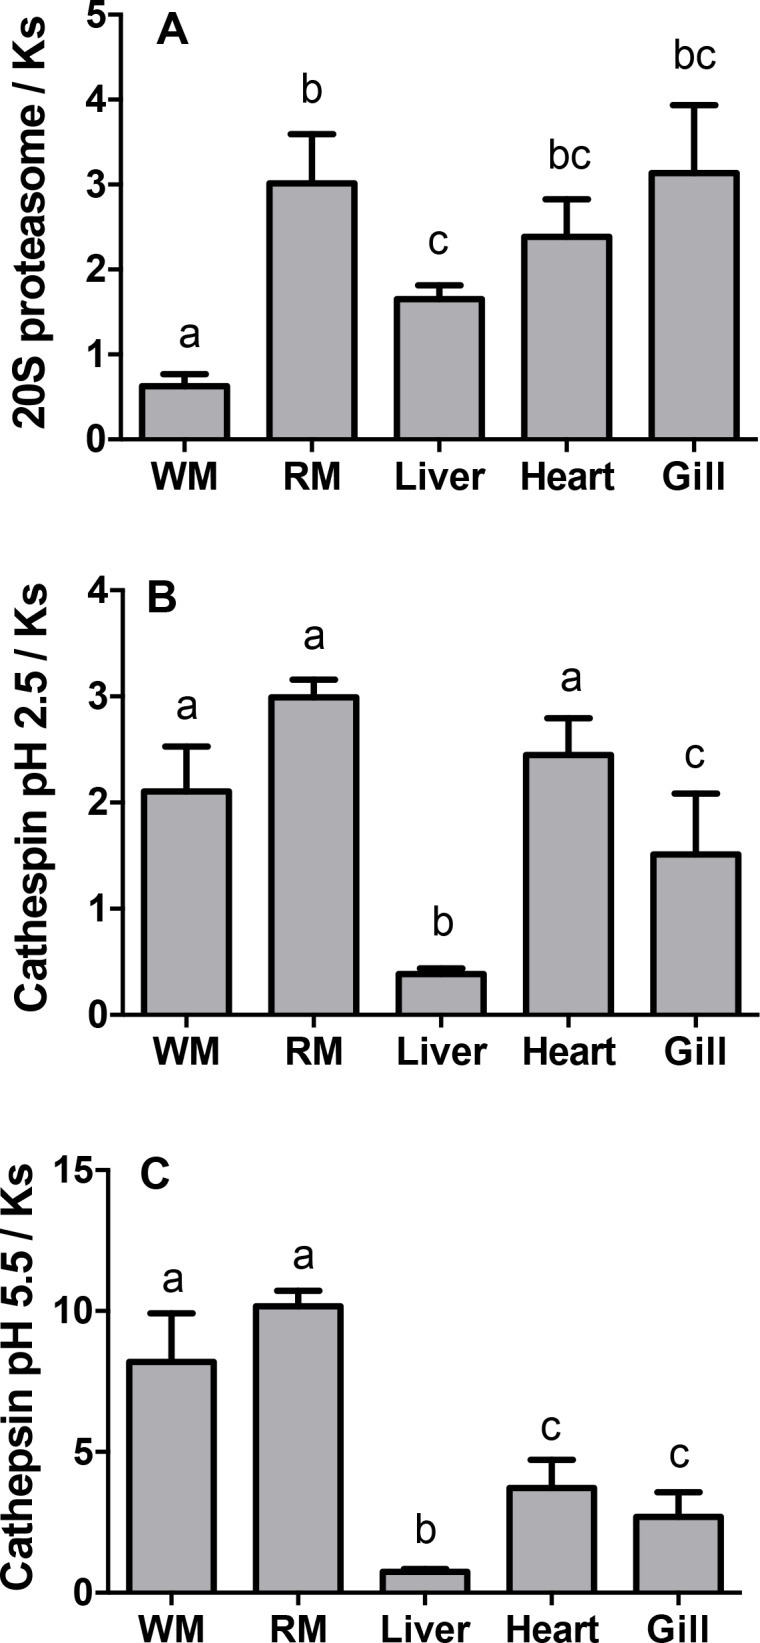
Fig 3. Ratios of protease activity relative to fractional rates of protein synthesis (Ks) in tissues of fed Arctic charr.

(A) maximal 20S proteasome activity, (B) cathepsin pH 2.5 activity and (C) cathepsin pH 5.5 activity. Note that these ratios do not have units and are for comparison purposes only. Different letters indicate significant difference (p < 0.05). Values are expressed as means ± s.e.m. (n = 7).
