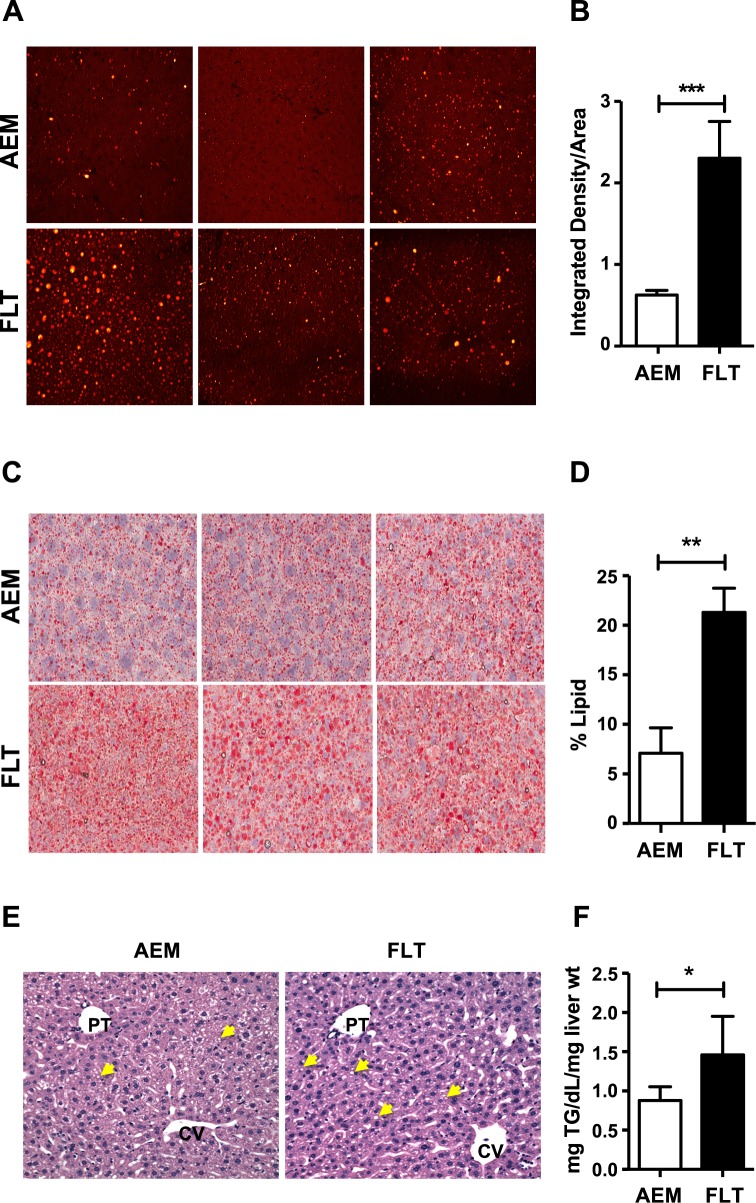
Fig 2. Spaceflight mice have increased accumulation of hepatic lipid droplets.
A) Frozen liver tissue was cryosectioned using OCT solution and sections imaged by CARS at a magnification of 60×. Representative images are shown from 3 different animals in each group. Images from AEM ground controls appear on the top panel and FLT mice on the bottom panel. B) Multiple regions were imaged from 2 cryosections taken at different tissue depths per animal (n = 5/group). Images were processed using ImageJ and integrated pixel intensity measured for each unit area. A Mann-Whitney test was used to compare integrated intensity values between groups. ***P < 0.001. C) Cryosectioned samples were stained with Oil Red O and imaged at 40× using an Aperio scanner. Sections from AEM and FLT mice were analyzed. Representative images from 3 mice per group are shown. D) Following color deconvolution, where dark red staining was used as an indicator of positive lipid signal, the percent of positive lipid signal was calculated per unit area for samples from n = 5 mice per group. A Mann-Whitney test was used to compare between groups and the mean ± SEM is shown. ** P < 0.01. E) H&E staining was performed on fixed liver sections from n = 4–5 mice/group to investigate liver histology. Inspection of the H&E stained sections revealed that the AEM ground control mice (left panel) had predominantly small zone 2 cytoplasmic lipid droplets (CLD) whereas the FLT mice (right panel) had an increase in slightly larger CLD in a panlobular pattern. Multiple lipid droplets are indicated using yellow arrows in representative images from each group. F) Total triglycerides were measured from n = 6 mice/group using a colorimetric assay (540 nm). A Mann-Whitney test was used to compare the calculated concentration values between groups. Data shown are mean ± SEM. * P < 0.05.

