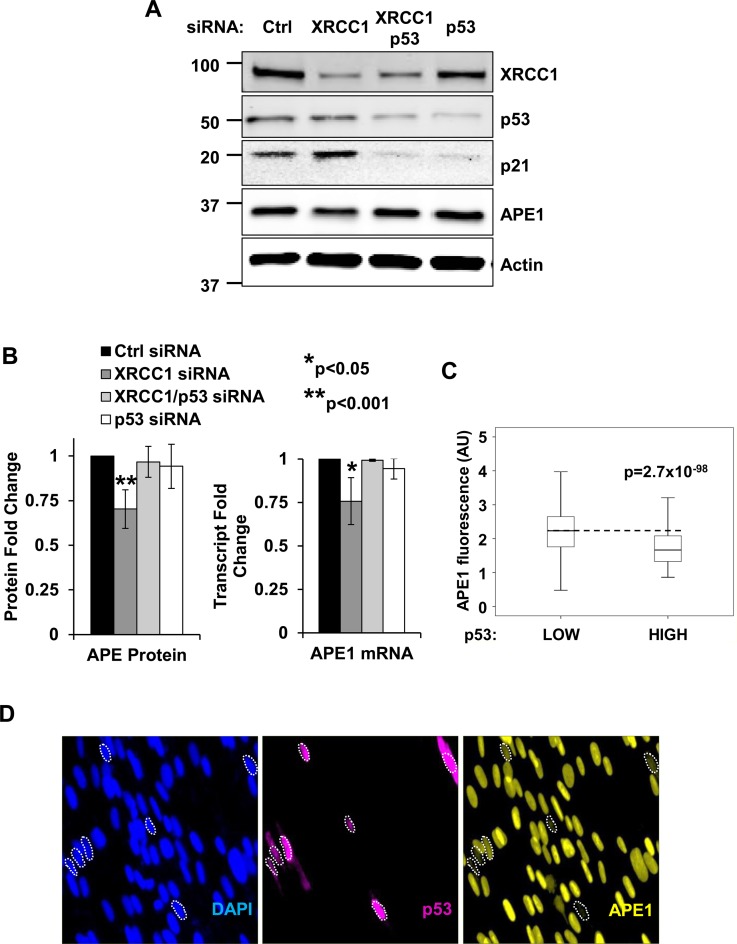
Figure 2.
Downregulation of APE1 in response to BER unbalance is dependent of p53. (A) Representative western blotting analysis on TIG-1 cells depleted of XRCC1 and p53. APE1 is downregulated upon XRCC1 knockdown in a p53-dependent manner. Actin was used as loading control. (B) Left: histogram showing the quantification of APE1 protein amount in the experiment showed in panel A (N = 5). Right: histogram illustrating the amount of APE1 transcript upon combined XRCC1/p53 depletion, as measured through qPCR (N = 3). Results are expressed as mean ± SD of the indicated number (N) of independent experiments. (C) Boxplot showing the distribution of APE1 staining intensity (in arbitrary units) in p53 low versus p53 overexpressing cells. The dashed line highlights the median APE1 intensity in p53 low cells (N > 8000). (D) Representative high-throughput immuno-fluorescence pictures showing TIG-1 cells stained for APE1 (right panel) and p53 (middle panel) after transfection with a p53 expressing plasmid. Cells that downregulating APE1 in response to p53 overexpression are marked by a contour line.

