Figure 4.
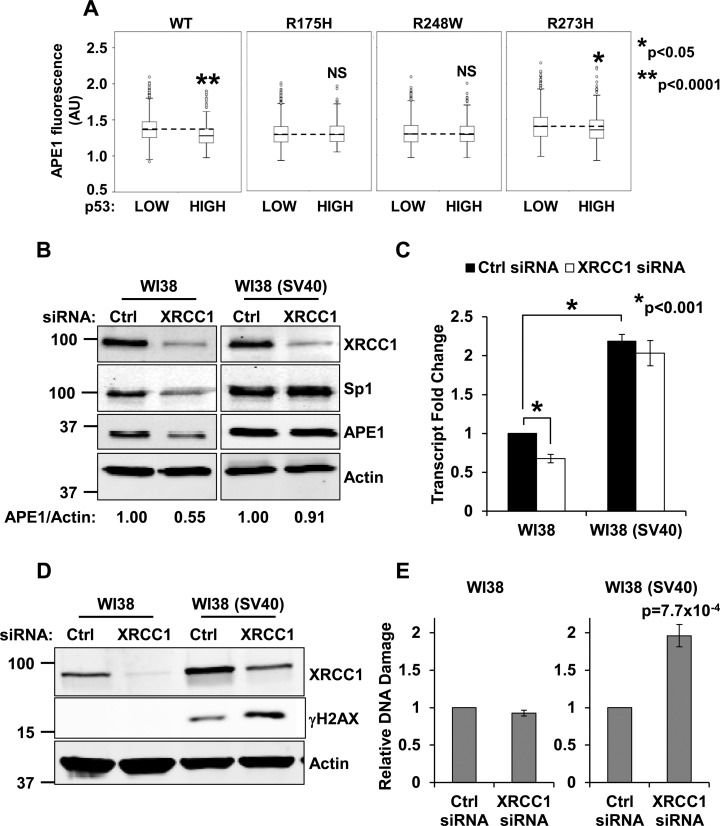
Defective p53 activity leads to failure of the BER coordination system. (A) High-throughput microscopy analysis of TIG-1 cells transfected with plasmids expressing wild-type or mutant p53. Boxplots showing the distribution of APE1 staining intensity (in arbitrary units) in p53 low versus p53 overexpressing cells. Each p53 mutant is reported on top of the relevant plot. The dashed line highlights the median APE1 intensity in p53 low cells (N > 5000). NS: not statistically significant at P < 0.05. (B) Representative western blotting analysis comparing WI38 and WI38 (SV40) cells upon transfection with the indicated siRNAs. Failure to downregulate Sp1 correlates with the inability to modulate APE1. Actin was used as loading control. (C) qPCR analysis on APE1 transcript in WI38 and WI38 (SV40) cells upon transfection with the indicated siRNAs. APE1 transcription is reduced in WI38 cells only. Note the higher transcript content in WI38 (SV40) cells. (D) Representative Western blotting analysis comparing WI38 and WI38 (SV40) cells upon transfection with the indicated siRNAs. Failure to modulate BER correlates with γH2AX staining in WI38 (SV40) cells; γH2AX increases further upon XRCC1 depletion. (E) Neutral Comet assay on WI38 and WI38 (SV40) fibroblasts shows accumulation of DSBs upon XRCC1-depletion in transformed cells only. Results are expressed as mean ± SD of three independent experiments.

