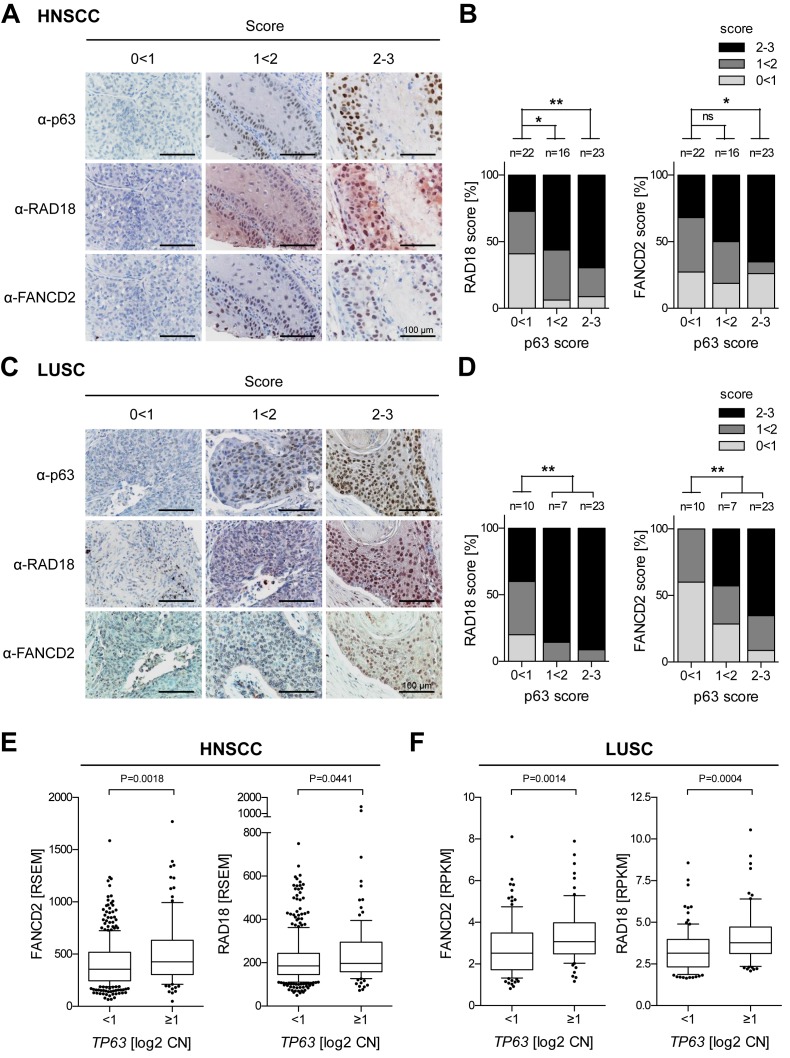
Figure 7.
p63 levels correlate with RAD18 and FANCD2 expression in SCC patients. (A–D) Tissue microarrays of paraffin-embedded SCC samples (A and B) HNSCC; (C and D) LUSC were immunostained for p63, FANCD2 and RAD18. Protein levels were scored as low (0 < 1), intermediate (1 < 2) and high (2–3). (A and C) Representative images. (B and D) Distribution of RAD18 and FANCD2 scores plotted against p63 levels. n = number of samples analyzed; statistical significance tested by χ2 test. P-value ***<0.001, ** 0.001<0.01, * 0.01<0.05, ns >0.05. (E and F) FANCD2 and RAD18 overexpression in HNSCC (E, n = 493) and LUSC (F, n = 178) with TP63 copy number (CN) gain [log2 CN ≥ 1]. RNAseq and CN data were taken from The Cancer Genome Atlas (TCGA). Box plots show RNA expression (RSEM or RPKM), whiskers: 10th and 90th percentiles. Statistical significance tested by Mann–Whitney test.

