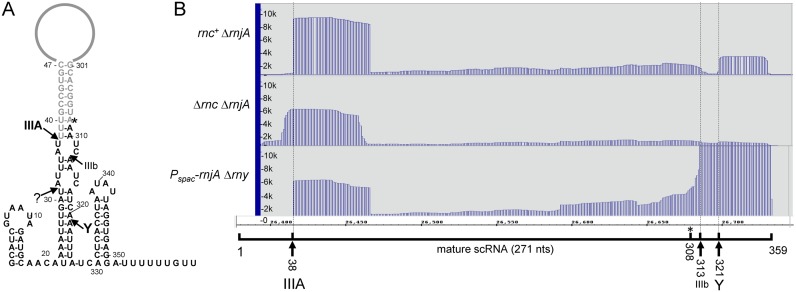
Figure 1.
Analysis of scRNA. (A) Schematic diagram of scRNA, showing major sites of RNase III (IIIA) and RNase Y (Y) cleavage. Minor site of RNase III cleavage (IIIb) is also indicated. Sequences present in the fully-processed scRNA are shown in gray. The mature 5′ end is created directly by RNase III cleavage at 38 nts, and the mature 3′ end is created by RNase Y cleavage, followed by 3′ exonuclease trimming to 308 nts (asterisk). (B) PARE data for scRNA in three strains, with genotypes indicated at left. Below the PARE data is a schematic of the 359-nts scRNA transcript with endonuclease cleavage sites indicated and correlated with PARE peaks.

