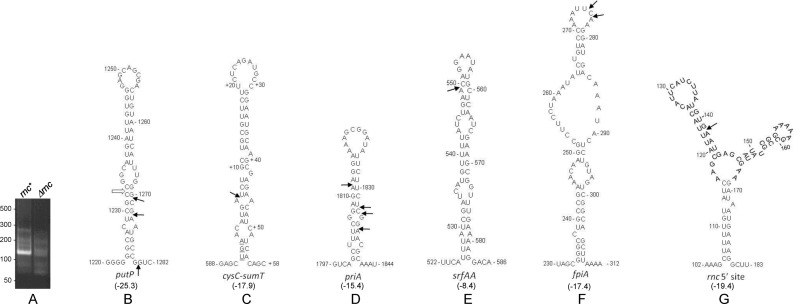
Figure 2.
5′ RLM-RACE mapping of RNase III cleavage sites. (A) 5′ RLM-RACE amplification products for mapping putP 5′ end generated by RNase III. A PCR product of the expected size is observed only in the rnc+ strain. (B–G) Predicted structures of RNA regions initially identified by PARE analysis to contain RNase III cleavage sites. The structures with the lowest predicted free energy are shown. Values in kilocalories/mol are given in parentheses below each structure. 5′ ends mapped by RLM-RACE are indicated by arrows. Open arrow in Figure 2B indicates the 5′ end of a fragment observed by PARE and Northern blot data but not mapped by RLM-RACE (see text).

