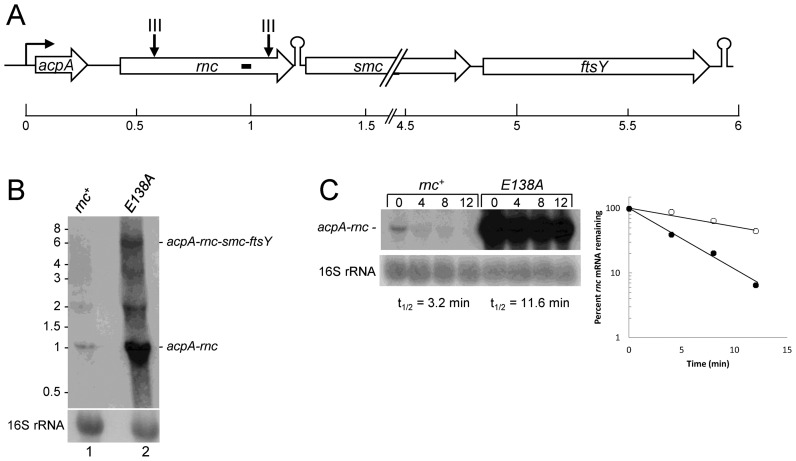
Figure 5.
rnc mRNA. (A) Schematic diagram of acp operon. Representations are as in Figure 3A. (B) Northern blot analysis of steady state rnc operon RNA in rnc+ and E138A strains. The probe was a 5′-end labeled oligonucleotide complementary to 533–553 nts of the rnc CDS (indicated by small bar in rnc CDS in Figure 5A). Migration of full-length operon RNA and acpA-rnc mRNA indicated on the right. Migration of unlabeled RNA size markers indicated on the left. (C) Northern blot analysis of rnc mRNA half-life. The probe was the same probe as in part B. Above each lane is the time (min) after rifampicin addition. Half-life quantitation shown in graph at right: closed circles, rnc+; open circles, Δrnc.

