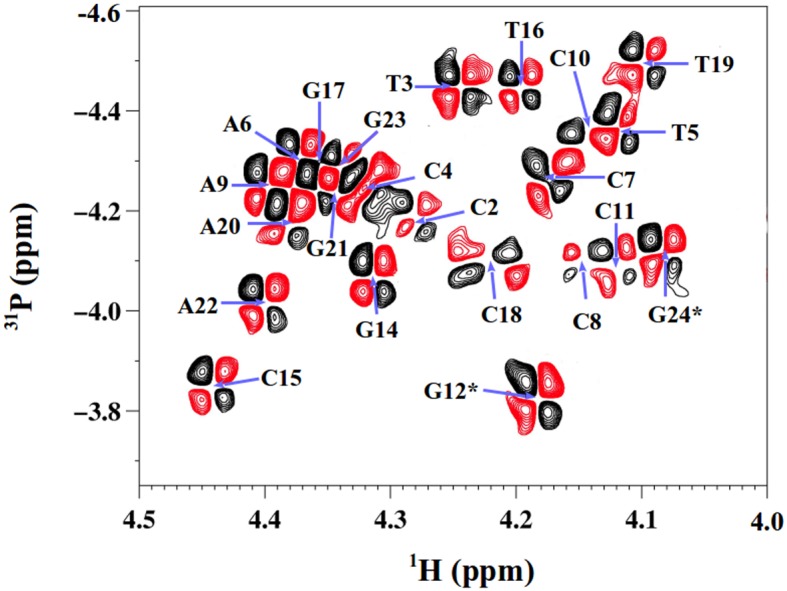
Figure 2.

Representative 1H-31P HETCOR spectrum at 500 Mhz for δP determination. The 1H -31P HETCOR spectrum, used to determine δPs of pN residues (N for any base), shows a section of the H4′-31P region collected with Oligo 2 at 20°C. The positive and negative cross-peaks are in black and red, respectively. The blue arrows indicate the cross-peak centers for specific bases. The terminal residues are indicated by stars.
