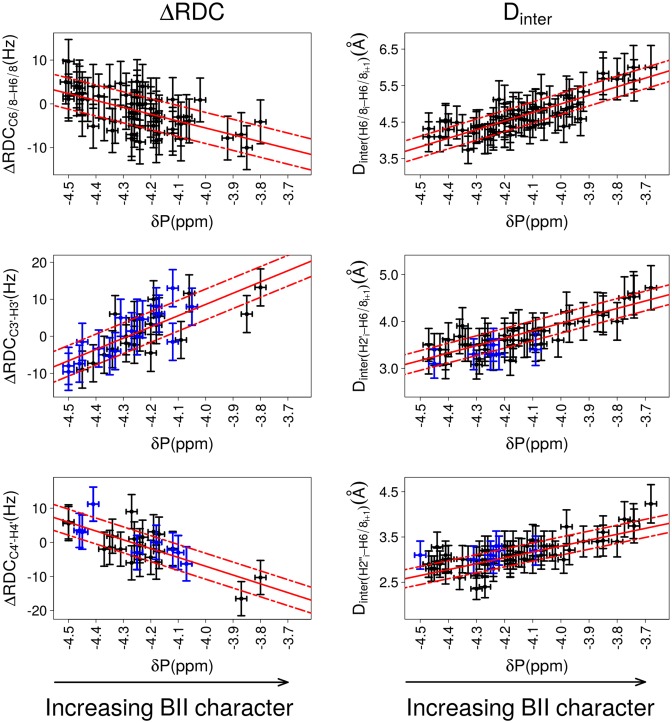
Figure 4.
Correlations between δP and ΔRDCs or internucleotide distances. The relative orientation of bases of the same strand in a base step is characterized either by ΔRDCs (left panels) or by internucleotide distances (right panels). The backbone conformation is represented by 31P chemical shifts (δP). ΔRDCs were calculated from RDCs measured at 25°C; δP and Dinter were collected at 20°C. The data exclude the terminal steps, which are shown in Figure 7. Left: Correlations between δPs and ΔRDCC6/8-H6/8, ΔRDCC3′-H3′ and ΔRDCC4′-H4′., with ΔRDC = RDCresidue i+1 – RDCresidue i. Right: Correlations between δPs and the internucleotide distances Dinter(H6/8i-H6/8i+1), Dinter(H2′i-H6/8i+1) and Dinter(H2″i-H6/8i+1). This data set also contains measurements previously collected on the Jun-Fos oligomer (37,68). Note that Dinter(H6/8i-H6/8i+1) > 5 Å are extracted from NOESY spectra recorded with a mixing time of 300 ms and are thus less precisely measured than shorter distances. The points in blue in panels involving ΔRDCC3′-H3′, ΔRDCC4′-H4′, Dinter(H2′i-H6/8i+1) and Dinter(H2″i-H6/8i+1) correspond to dinucleotides with detectable populations of East or North sugars. The vertical bars are the estimated experimental errors on ΔRDC and Dinter (see Materials and Methods). The experimental error on δPs (horizontal bars) is estimated to ±0.05 ppm for the left panel plots and to ±0.02 ppm for the right panel plots (see Materials and Methods). The best linear fits are represented with red lines; the residual standard deviations are depicted by dashed red lines. The characteristics of the correlations are reported in Table 2.

