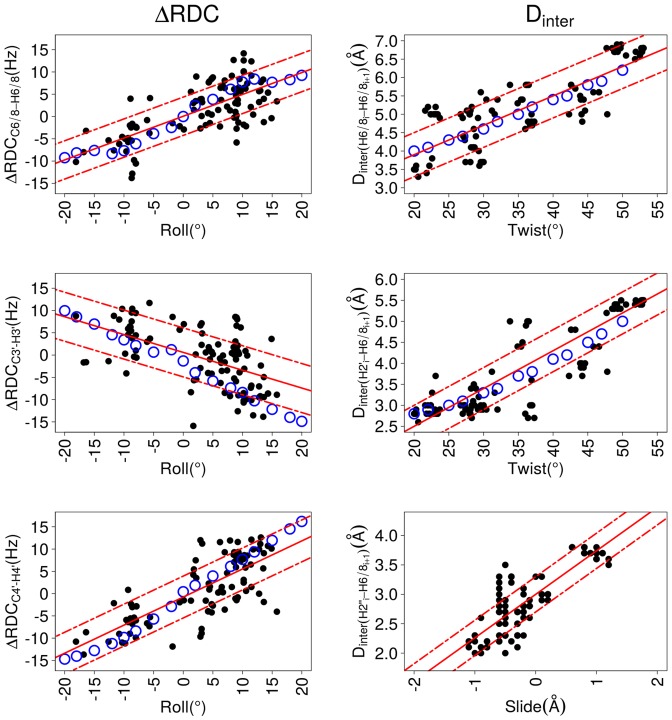
Figure 5.
Dependence of inter base parameters on ΔRDCs and Dinter. These plots illustrate correlations between inter base parameters of roll, slide and twist versus residual dipolar coupling differences (ΔRDCs) or internucleotide distances (Dinter). ΔRDC, Dinter, slide, roll and twist were obtained from the high resolution X-ray B-DNA structures (black points, characteristics in Table 4) or from 3DNA molecular models (blue circles). The best linear fits calculated for the X-ray structures (equations in Table 6) are represented by red lines; the standard deviations of the residuals are traced by dashed red lines. The inter-base parameters were calculated for each strand of the DNA double helix, to be consistent with ΔRDCs and Dinter.

