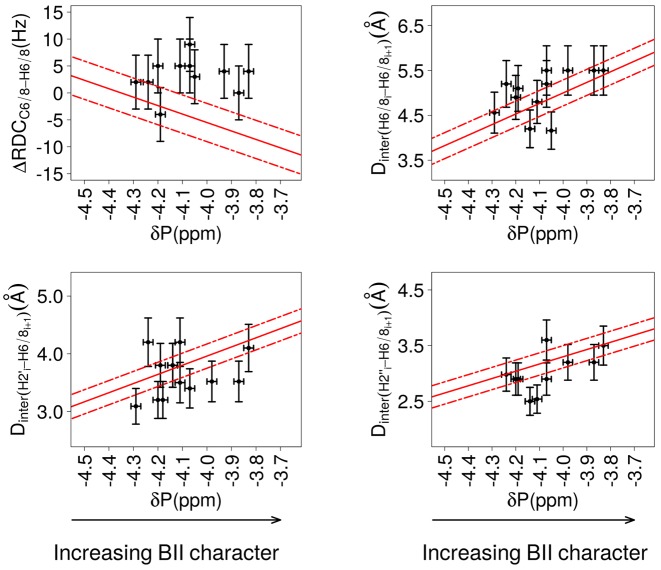
Figure 7.
Behavior of terminal dinucleotides regarding δP versus ΔRDCs or internucleotide distances. 31P δP, ΔRDCC6/8-H6/8, Dinter(H6/8i-H6/8i+1), Dinter(H2′i-H6/8i+1) and Dinter(H2″i-H6/8i+1) were collected on the first and last dinucleotides of the four dodecamers, at 20°C. They are compared to the correlations obtained for the internal dinucleotides (see Figure 4), which are depicted here by the best linear fits (red lines) and the standard deviations of the normal distribution of the residuals (dashed red lines). The bars are the estimated experimental errors on ΔRDC and Dinter (vertical bars) and δP (horizontal bars).

