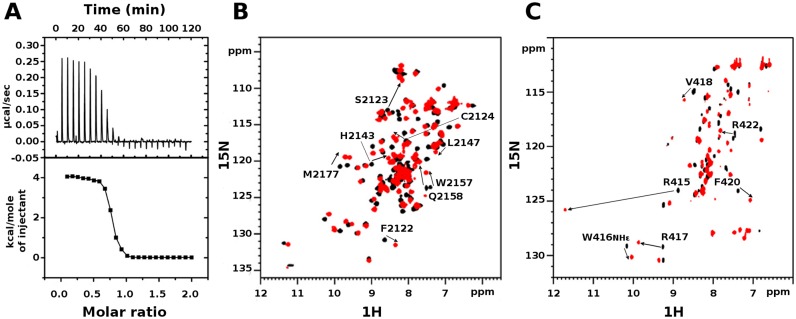
Figure 3.
Interaction between PHDVC5HCHNSD1 and C2HRNizp1. (A) ITC-binding curves of C2HRNizp1 to PHDVC5HCHNSD1. The upper panel shows the sequential heat pulses for domain–domain binding, and the lower panel shows the integrated data, corrected for heat of dilution and fit to a single-site-binding model using a nonlinear least-squares method (line). (B) Superposition of 1H–15N HSQC spectra of PHDVC5HCHNSD1 without (black) and with (red) C2HRNizp1. (C) Superposition of 1H-15N HSQC spectra of C2HRNizp1 without (black) and with (red) PHDVC5HCHNSD1. The peak with the down shift to 11.8 ppm upon PHDVC5HCHNSD1 addition corresponds to the backbone amide of R415Nizp1, suggesting the presence of an H-bond upon complex formation. Peaks shifting more than <CSP>+1σ are explicitly labeled.

