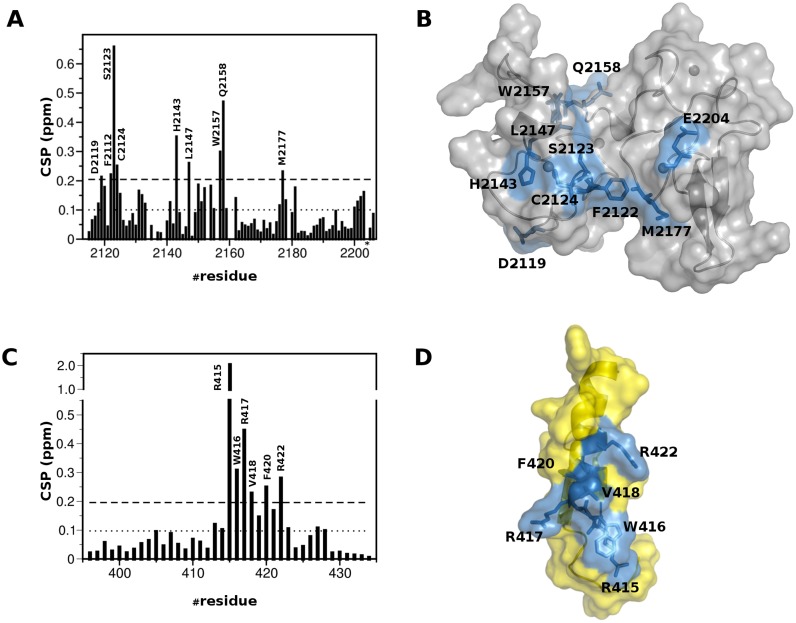
Figure 5.
Mapping of the interaction between PHDVC5HCHNSD1 and C2HRNizp1. (A) Histograms showing the averaged backbone chemical shift differences observed in PHDVC5HCHNSD11H–15N HSQC (0.2 mM) upon addition of a 2-fold excess of C2HCRNizp1. Missing bars correspond to either Prolines or amides that are not visible because of exchange with the solvent. The asterisk indicates peak disappearance (Glu2204NSD1) upon binding. The last two bars in the plot correspond to the indole amides of W2157NSD1 and W2168NSD1, respectively. (B) Cartoon and surface representation of PHDVC5HCHNSD1. Residues showing significant chemical shift perturbation are represented in sticks and coloured in blue. (C) Histograms showing the averaged backbone chemical shift differences observed in C2HCRNizp11H–15N HSQC (0.2mM) upon addition of a 2-fold excess of PHDVC5HCHNSD1 In all the histograms, the dotted line represents <CSP>, the dashed line represents <CSP> + 1σ value, where σ corresponds to standard deviation. (D) Cartoon and surface representation of C2HRNizp1 (yellow). Residues showing significant chemical shift perturbation are represented in sticks and are coloured in blue.

