
Figure 3.
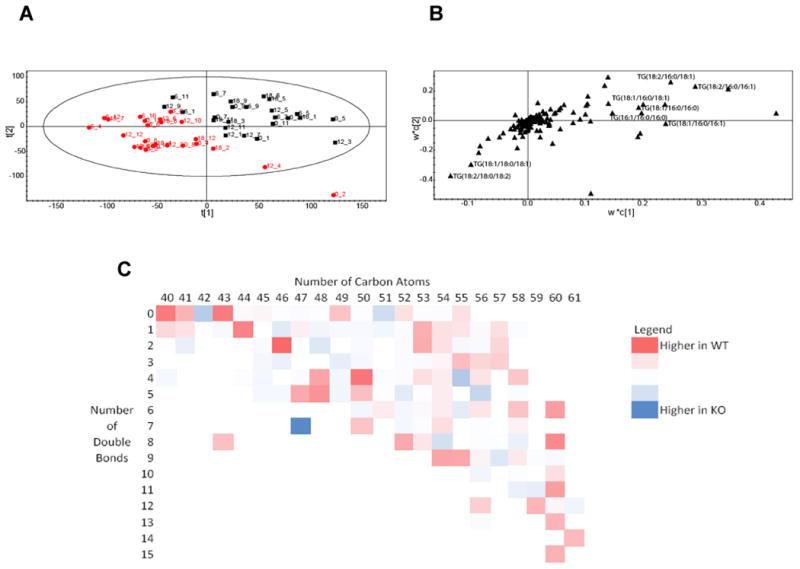
A. Score plot showing the separation according to genotype between Ad-Arntl−/− and control mice in the fatty acid profiles obtained by LC-MS analysis of BAT. The black squares represent samples belonging to control animals, the red circles samples belonging to Ad-Arntl−/− mice. B. Loading plot for the score plot in A, shows the lipids responsible for the discrimination between the groups. C. Heat map with the ratio between lipids in BAT in Ad-Arntl−/− and control mice, as a function of the numbers of carbon atoms and number of double bonds in the lipid. Blue circles indicate lipid species more concentrated in Ad-Arntl−/− mice, while red cells indicates lipids less concentrated in Ad-Arntl−/− mice.