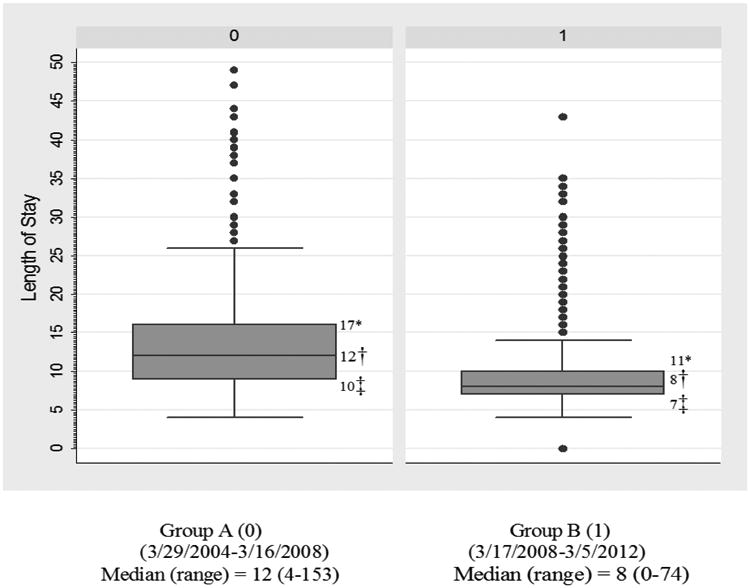
Figure 1.

Box and whisker plot for LOS. The box (interquartile range) has 50% of all data while the whiskers extend to the 5th and 95th percentile. Dotes indicate data beyond 5th and 95th percentile. On Y Axis, the unit of measurement for Length of stay is ‘number of days’.
*75th percentile
†50th percentile (median)
‡25th percentile
