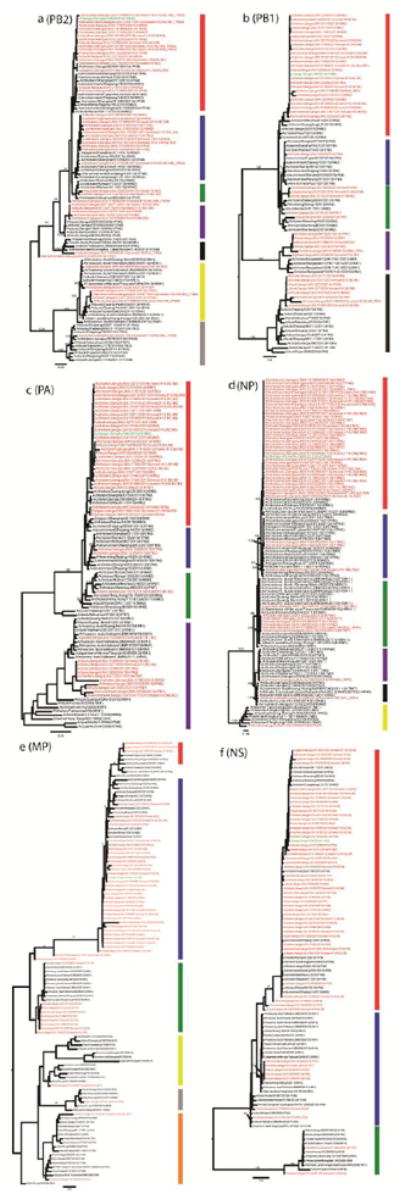
Figure 2. Phylogenetic analysis of PB2 (A), PB1 (B), PA (C), NP (D), MP (E), and NS (F) genes recovered from the samples collected from the LPM which the index patient visited.

The details of these genes are shown in Supplementary Table S2. The genes from this surveillance are marked in red, and those from the human H10N8 isolate in green. The bootstrap values for representative lineages are marked.
