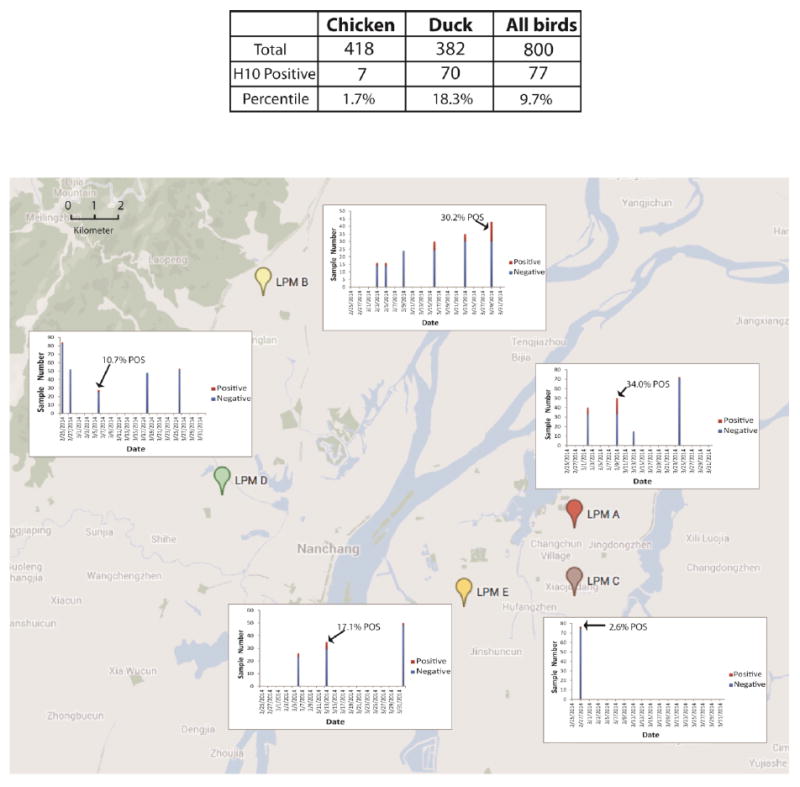
Figure 3. Distribution of H10 seropositive samples collected from February 25 to March 27, 2014 and across five LPMs in Nanchang city.

The seropositive samples were determined by hemagglutination inhibition assays with a H10N8 virus isolated from the surveillance described above and a cutoff of 1:20. LPM A was the one that the first index H10N8 patient visited in November 2013. The highest H10 positive percentile in a single sampling period was marked for each LPM.
