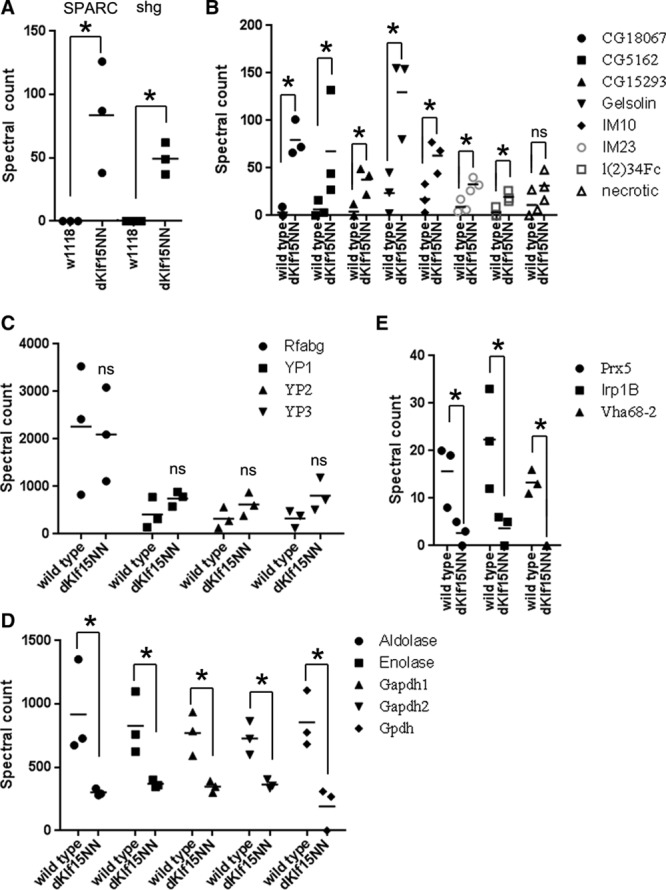
Figure 6.

Mean spectral counts of hemolymph proteins. A, Counts for 2 most abundant proteins found only in the dKlf15NN mutants hemolymph. B, Proteins showing an increase in the mutant’s hemolymph. C, The most abundant proteins in the hemolymph of wild-type and dKlf15NN mutants. D, Proteins significantly reduced in the hemolymph of the dKlf15NN mutants. E, Proteins showing the largest, statistically significant, decrease in the mutant’s hemolymph; n=3 independent hemolymph samples from ≈100 flies of each genotype; *P<0.05, ns indicates no significant difference. SPARC indicates secreted protein acidic and rich in cysteine.
