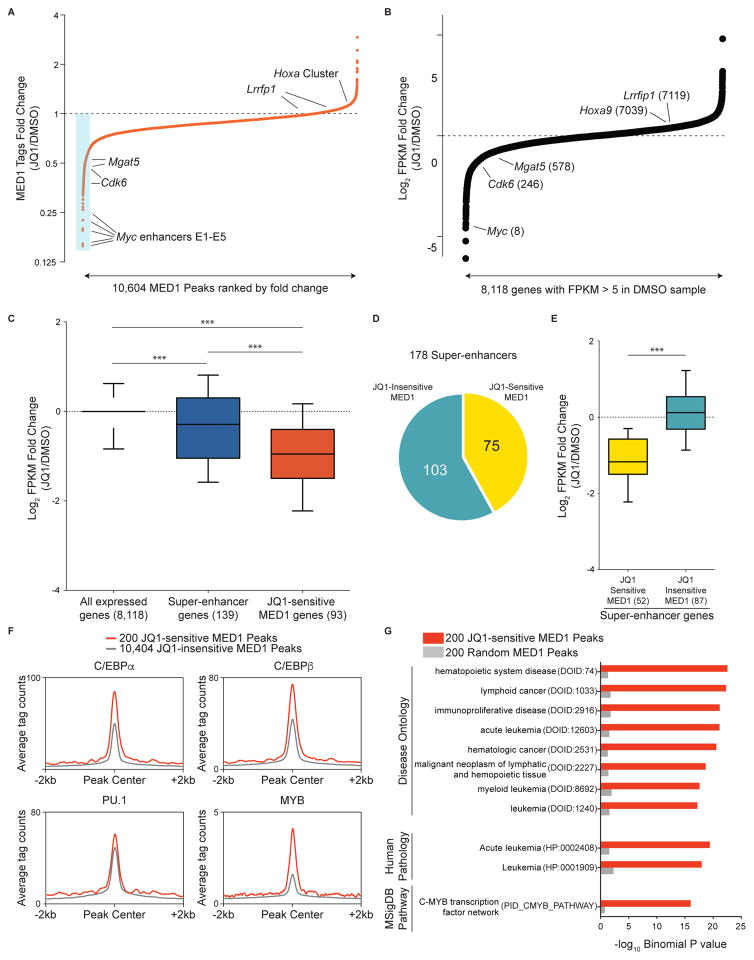
Figure 2. JQ1-induced Mediator eviction correlates with JQ1-induced transcriptional suppression.
(A) Fold-change in occupancy of MED1 at 10,604 individual MED1 peaks in AML following 2 h treatment with 500 nM JQ1. The peaks are ranked in order of increasing fold change (JQ1/DMSO). The blue box highlights the 200 most JQ1-sensitive MED1 elements. Fold changes presented are the average of two independent biological replicates.
(B) Fold-change in FPKM (fragments per kilobase of transcript per million) for 8,118 expressed genes in AML (defined by FPKM>5 in DMSO sample) following 6 h of 500 nM JQ1 treatment. The genes are ranked in order of increasing fold change. The numbers in parentheses are the fold-change expression rank of the indicated genes.
(C) Average fold-change in FPKM after JQ1 treatment for all expressed genes (left), for genes associated with super-enhancers (center), and for genes associated with JQ1-sensitive MED1 peaks (right). The numbers in parentheses represent the number of genes matched to the class of peaks indicated. *** represents a p value < 0.0001, the result of a Mann-Whitney test.
(D) Stratification of 178 MED1 super-enhancers based on whether or not they overlap with at least one of the 200 JQ1-sensitive MED1 peaks (minimum overlap 1 bp).
(E) Average fold change in FPKM for genes associated with JQ1-sensitive MED1 super-enhancers and for genes associated with JQ1-insensitive MED1 super enhancers (as delineated in (D)). The numbers in parentheses represent the number of genes matched to the subclass of super-enhancer indicated. *** represents a p value < 0.0001, the result of a Mann-Whitney test.
(F) ChIP-seq meta-profiles for hematopoietic TF occupancy at 200 JQ1-sensitive MED1 peaks or the remaining 10,404 MED1 peaks.
(G) GREAT ontology analysis Binomial P values for 200 JQ1-sensitive MED1 peaks versus 200 random MED1 peaks. Top-ranking ontology terms for the JQ1-sensitive peaks are displayed alongside values for the same ontology terms in the random peaks. Terms in parentheses represent the ontology identifiers in the GREAT database.

