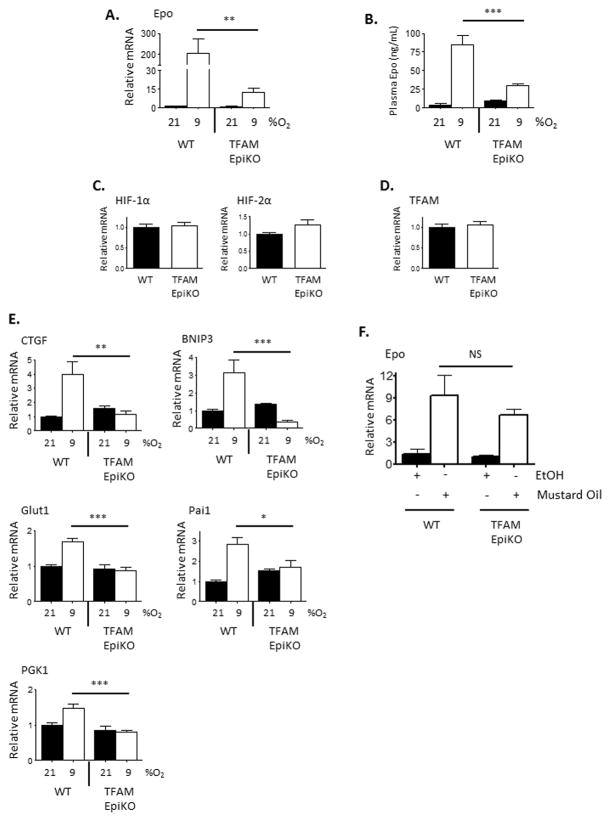
Figure 3.
Hypoxic induction of HIF-1α target genes and erythropoietin is inhibited in the kidneys of TFAM EpiKO mice. (A) Real Time PCR analysis of Epo mRNA expression in renal lysates prepared from wild-type and TFAM EpiKO mice. Mice were exposed to normoxia or hypoxia for 16 hours. (B) Epo protein concentrations in the serum of wild-type and TFAM EpiKO mice as determined by ELISA. (C, D) Real Time PCR analysis of (C) HIF-1α, HIF-2α, or (D) TFAM mRNA expression in the kidney of wild-type and TFAM EpiKO mice. (E) Real Time PCR analysis of CTGF, Bnip3, Glut1, Pai1, and PGK1 mRNA expression in the kidneys of wild-type and TFAM EpiKO mice exposed to normoxia (21% O2) or hypoxia (9% O2) for 16 hours. (F) Real Time PCR analysis of Epo mRNA expression in the kidneys of wild-type and TFAM EpiKO mice exposed to epidermal application of either mustard seed oil (Allyl isothiocyanate) or EtOH as vehicle control. Charts represent means +/− SEM. mRNA expression was normalized to RPL19 levels. (A–E) N=5, (F) N=3 mice per genotype per condition. Significance was determined by one way ANOVA using Bonferonni’s post-test.

