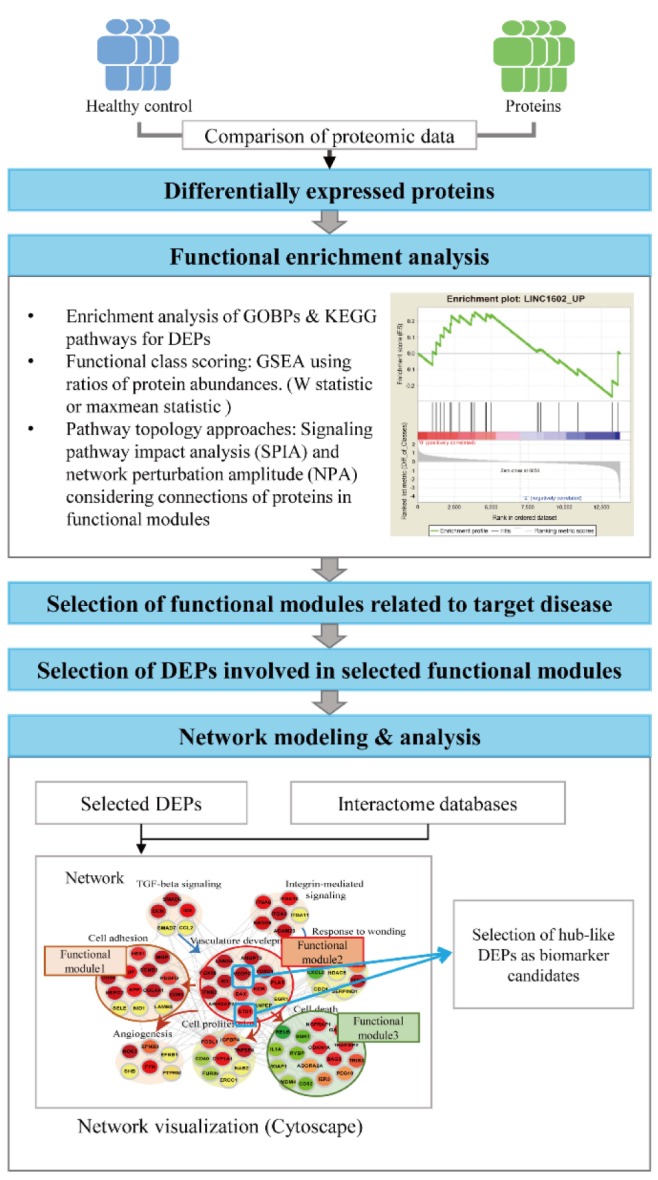
Fig. 2. Schematics for functional enrichment and network analyses of differentially expressed proteins (DEPs). Three types of functional enrichment analyses are shown. The output from gene set enrichment analysis (GSEA) is displayed as an example. Also, an example of network model is shown, which includes functional modules 1-3 (cell adhesion, vasculature development, and cell death, respectively). Node colors in the network model represent up- (red) and down-regulation (green), the color gradient denotes log2-fold-changes of the proteins, and gray lines represent the connections between the nodes. GOBPs, gene ontology biological processes; KEGG, Kyoto Encyclopedia of Genes and Genomes; TGF, tumor growth factor.

