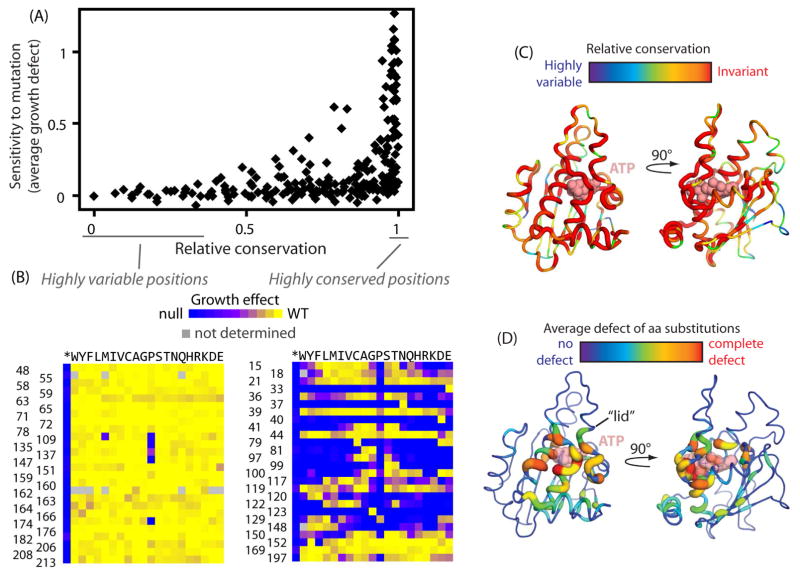
Figure 2. Relationship between evolutionary conservation and experimental fitness effects.
(A) Comparison of the experimental fitness sensitivity of each position in the N-domain to conservation observed in Hsp90 sequences from diverse eukaryotes. Positions exhibiting the strongest evolutionary conservation exhibit a broad range of experimental sensitivity to mutation while the most evolutionary variable positions are almost universally experimentally tolerant to mutations (B) Experimental fitness effects at amino acid positions that exhibited the greatest and least evolutionary variation. (C&D) Structural representations of the Hsp90 N-domain from 2CG9.PDB (Ali et al., 2006) where the width of the backbone trace and the color indicate the evolutionary variation (C) or experimental sensitivity to mutation (D) of each position.

