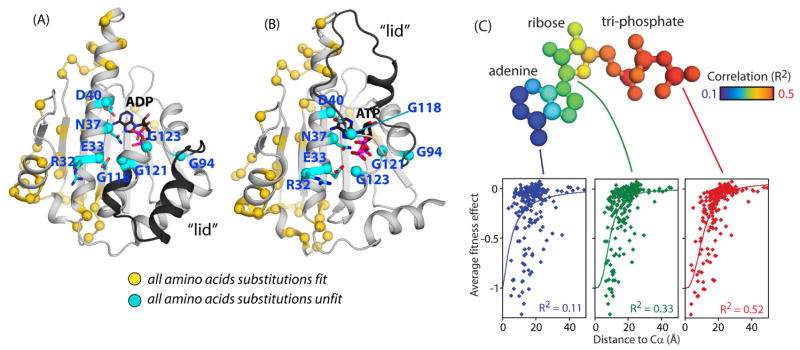
Figure 3. Structural distribution of experimentally sensitive and tolerant positions.
(A&B) Structural representations of the Hsp90 ATPase domain illustrating the location of the eight amino acids that are experimentally sensitive to any amino acid change (indicated with cyan spheres), and the 55 positions that experimentally tolerate any amino acid change (indicated with yellow spheres). Structural representations are shown for the ADP bound state from 1AM1.PDB (Prodromou et al., 1997) (A) and the ATP bound state from 2CG9.PDB (Ali et al., 2006) (B).(C) Sensitivity to mutations correlates with proximity to atoms in ATP. The atoms of ATP are colored based on the observed correlation between experimental fitness effects and distance to the Cα atoms of each amino acid residue. Distance to the γ-phosphate of ATP exhibits the strongest correlation and explains more than half of the observed variance in mutational sensitivity. See also Figure S2, S3, and S4.

