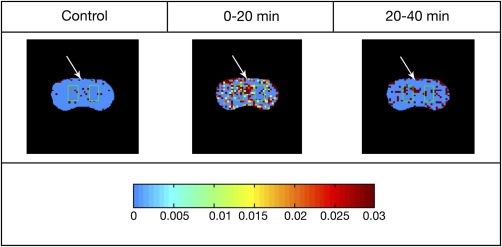
Figure 1.

Representative images of rat brain treated with 150TL at different time points. The color bar below the images shows changes in blood–brain barrier transfer coefficient Ki varying from 0 to 0.03 min− 1. Pixels with Ki > 0.03 min− 1 are assigned the same color as Ki = 0.03 min− 1. For each map, representative ROIs in each hemisphere are highlighted by green border and the white arrow points to the SSS. Rats were lying supine during data collection and images were inverted for illustration purposes. Please see text for further detail.
