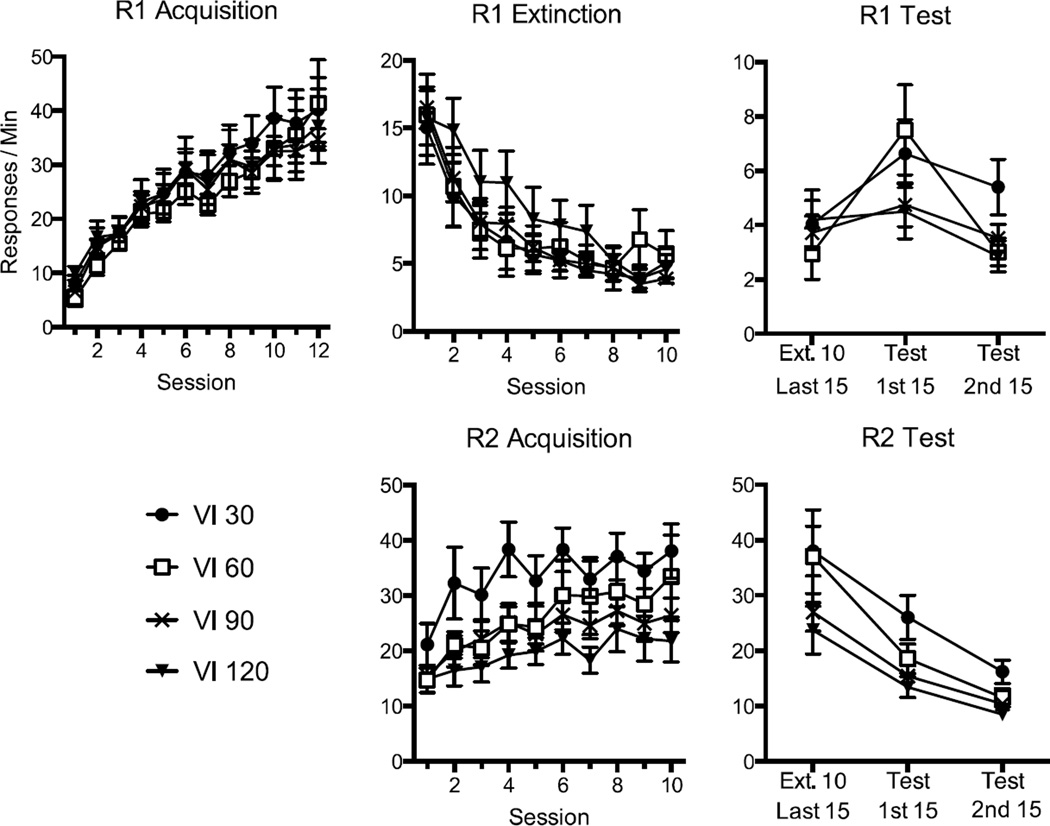
Figure 1.
Results of Experiment 1. Upper panels: Mean R1 responding (+ SEM) during acquisition (left), extinction (middle), and testing (right). Lower panels: Mean R2 responding (+ SEM) during its acquisition and testing. All groups received extinction of R1 at the same time R2 was introduced and reinforced on either a VI 30, VI 60, VI 90, or VI 120-s schedule of reinforcement. Note changes in the y axes between panels; error bars are only appropriate for between-group comparisons.

