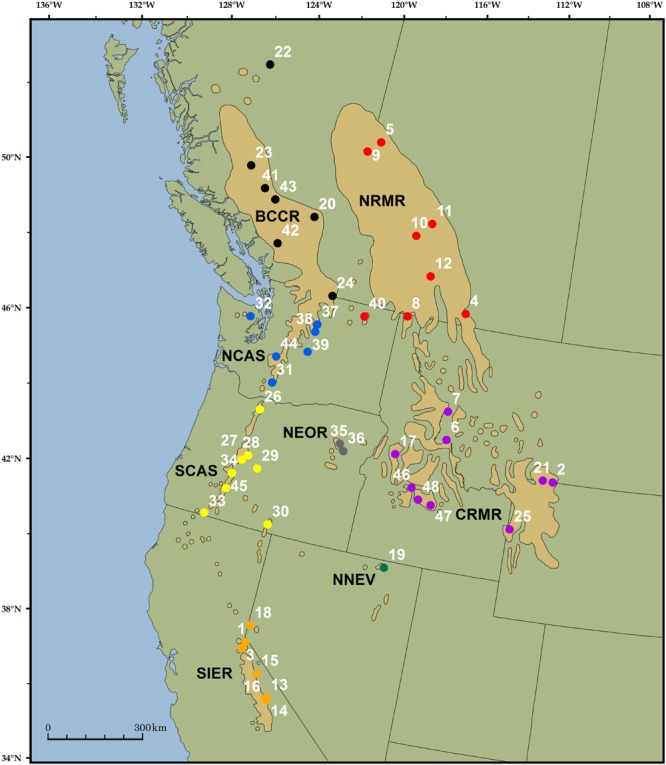
FIGURE 1.

Range of whitebark pine (tan polygons; Little, 1971) and the location of the 48 trees included in the analysis. Unique colors and associated four-letter abbreviations represent groups of samples chosen a priori based on previous research (Richardson et al., 2002). Sample 42 was excluded from sample-specific analyses due to poor quality sequencing.
