FIGURE 3.

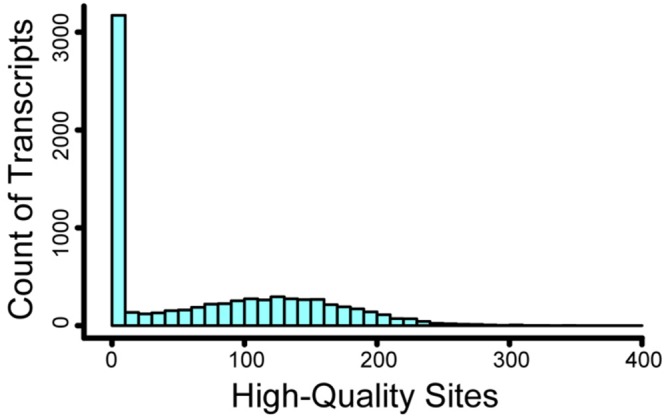
Histogram of high-quality sites per transcript. For over 3000 transcripts, we recovered no high-quality sites. For the remaining transcripts, the number of high-quality sites was approximately normally distributed with a mean of 119.

Histogram of high-quality sites per transcript. For over 3000 transcripts, we recovered no high-quality sites. For the remaining transcripts, the number of high-quality sites was approximately normally distributed with a mean of 119.