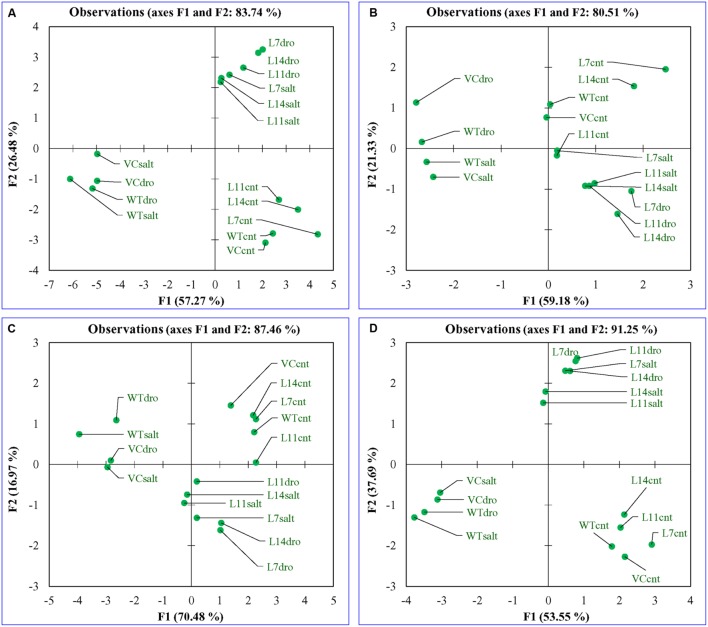
FIGURE 12.
Principal component analysis. Comparative PCA of (A) combine, (B) morphological, (C) biochemical, and (D) physiological response of transgenic lines (L7, L11, and L14) and control plants (WT and VC) under control and stress (NaCl and osmotic) condition. Individually, the morphological, biochemical, and physiological response of plants explained 80.51, 87.46, and 91.25% of variations, respectively, whereas in-combination they explained 83.74% variations.

