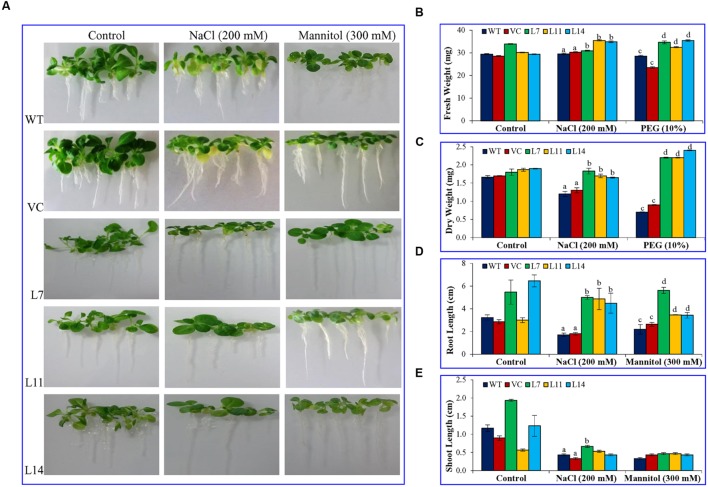
FIGURE 4.
Plant growth analyses under salt and osmotic stress. Comparative study of (A) morphology, (B) fresh weight, (C) dry weight, (D) root length, and (E) shoot length of transgenic lines (L7, L11, and L14) and control plants (WT and VC) under salt and osmotic stress. Bars represent means ± SE and values with different letters are significant at P < 0.05.

