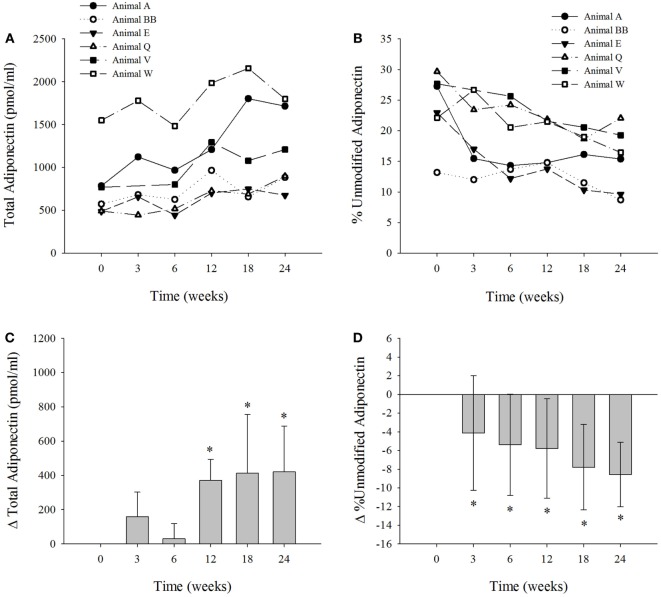
Figure 1.
The six bottlenose dolphins on a modified fish diet display an increase in total serum adiponectin and a decrease in percent unmodified adiponectin. Symbols and lines correspond to the measured values of (A) total adiponectin (picomole per milliliter) and (B) percent unmodified adiponectin in each dolphin from time 0 to week 24. (C) The mean change in total adiponectin and (D) mean percent change in percent unmodified adiponectin for the six dolphins at each time point over the 24-week study (n = 6; except for week 3, n = 5). Data are presented as means and error bars indicate SD. A repeated measures one-way ANOVA with a Holm–Sidak post hoc test was used to determine significant changes in adiponectin levels versus week 0 (*denotes P < 0.05).

