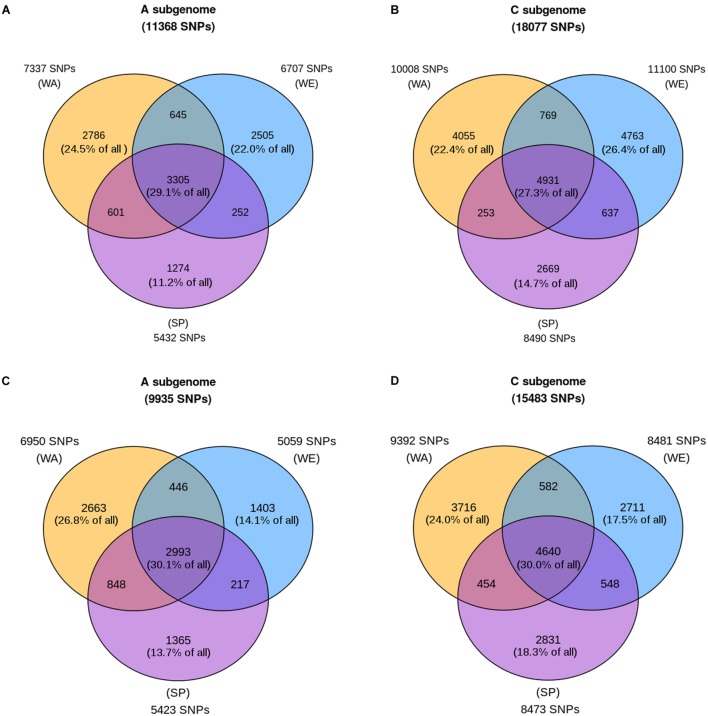
FIGURE 3.
Shared and subpopulation-specific polymorphism in the three major subpopulations. Each circle of the Venn diagram represents a subpopulation: winter Europe (WE), winter Asia (WA), and spring (SP). Counts adjacent to each circle are the number of SNPs with at least one copy of the minor allele in the subpopulation. For each subpopulation, these counts are further decomposed into three categories, depending on whether the minor allele is also present in one or two additional subpopulations (counts inside the Venn diagram). These counts are also expressed as percentages of the total SNP count across the three subpopulations (value given at the top of each panel). The top two panels (A,B) show values for the entire sample size for each subpopulation, while the bottom two panels (C,D) show the average counts after 100 random downsamplings of WE and WA to 185 samples each (matching the sample size of SP). The winter America subpopulation is not included in this analysis due to its small sample size.

