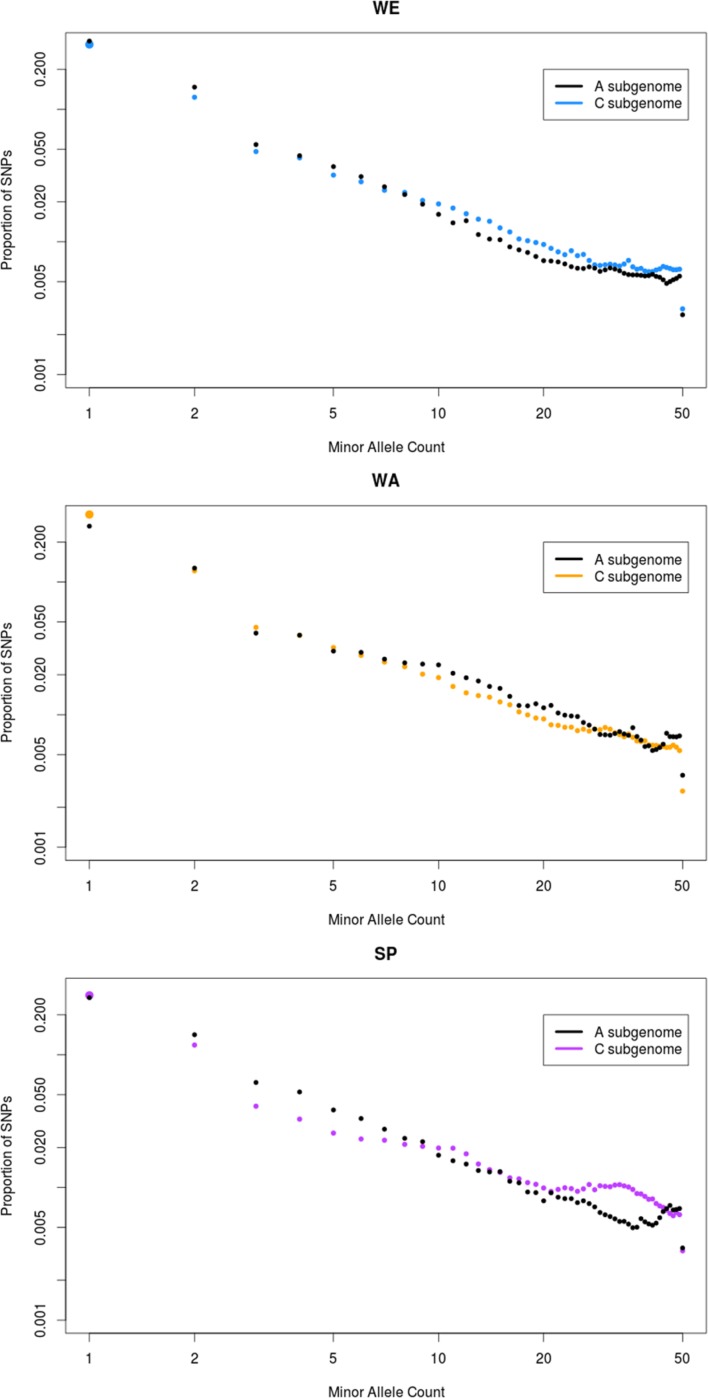
FIGURE 5.
Folded site-frequency spectrum (SFS) of the three major subpopulations. The analysis was conducted on each of the three major subpopulations: winter Europe (WE), winter Asia (WA), and spring (SP). The x-axis represents in log scale the number of copies of the minor allele observed for a SNP (minor allele count, MAC) in the subpopulation. The y-axis represents in log scale the proportion of SNPs in the subpopulation for all MAC. The black dots show the SFS for the A subgenome, while the SFS for the C subgenome is shown in other colors. In each subpopulation, all the SNPs were probabilistically downsampled to 50 genotypes to allow comparison of three major subpopulations despite their different sample size, and to avoid distortions due to an unequal amount of missing data across sites (see Materials and Methods).

