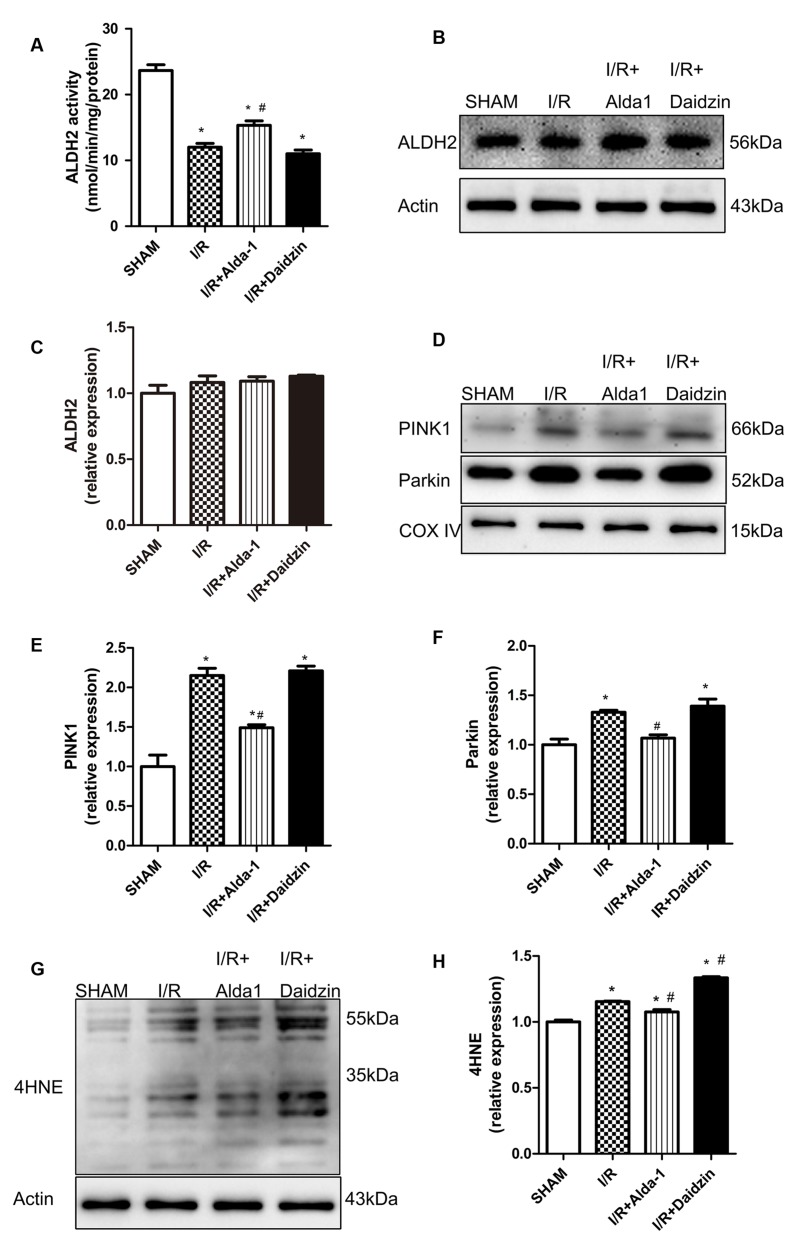
FIGURE 2.
ALDH2 activity and expression, 4HNE accumulation and mitophagy in I/R rats. (A) ALDH2 enzymatic activity (P < 0.0001, One-way ANOVA). (B) Representative gel blots of expression of ALDH2 and Actin (loading control). Quantification analysis of (C) ALDH2 expression using specific antibodies (p = 0.2671, One-way ANOVA). (D) Representative gel blots of expression of PINK1, Parkin and COX IV (mitochondrial loading control). Quantification analysis of (E) PINK1 expression and (F) Parkin expression (P < 0.0001, P = 0.0012, One-way ANOVA). (G) Representative gel blots of expression of 4HNE. Quantification analysis of (H) 4HNE expression (P < 0.0001, One-way ANOVA). n = 3/group. Data are mean ± SD from 3 independent experiments. ∗P < 0.05 vs. sham; #P < 0.05 vs. I/R.

