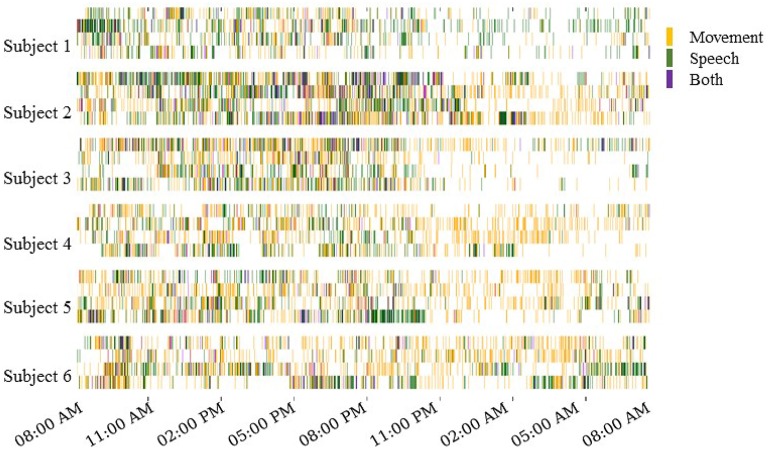
Figure 3.
Daily actograms for all subjects. Each row shows one day of activity profiles summarized by automated speech and motion recognition algorithms. Days 3–6 post surgical implantation were analyzed. For purposes of this visualization, the activity levels were binned to 1-min resolution. Movement and speech levels were highly correlated on most days, and these were concentrated to the active hours between 8:00 a.m. and 11:00 p.m.

