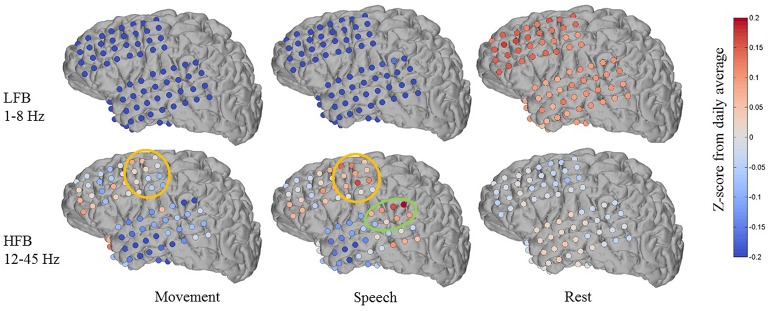
Figure 7.
Features discovered by automated brain decoding at two different frequency bands are consistent with known functions of cortical areas. Shown for one subject day (Subject 1 on day 6 post implant), the centroids of the movement, speech and rest clusters were back projected to brain-electrode space, and then separately averaged over a low frequency band (LFB, 1–8 Hz) and a high frequency band (HFB, 12–45 Hz). The orange and green circles mark the approximate extent of locations typically considered to be sensorimotor and auditory regions, respectively. The colormap indicates the Z-Score of the power levels as compared to the daily average.

