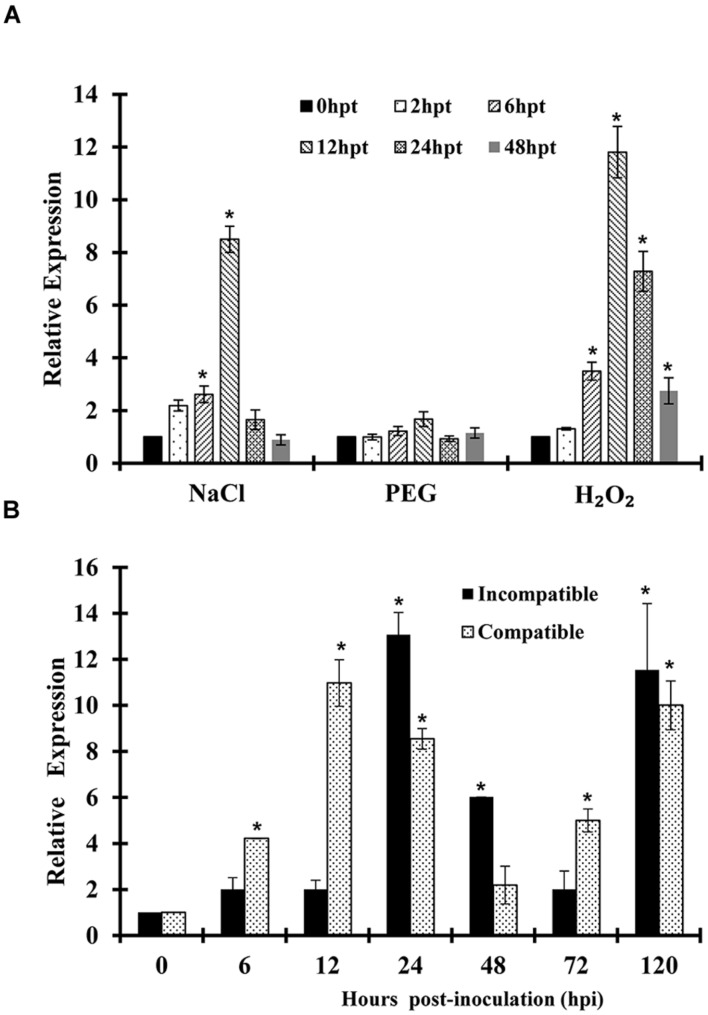
FIGURE 3.
Expression profiles of TaSYP71 in response to abiotic and biotic stresses. Expression levels were normalized to the wheat elongation factor TaEF-1a gene. The results are shown as the mean ± standard deviation of three biological replicates. (A) Wheat leaves were separately treated with PEG 6000, NaCl, or H2O2 and sampled at 0, 2, 6, 12, 24, 48 hpt. (B) Wheat leaves inoculated with CYR23 (incompatible) or CYR31 (compatible) were sampled at 0, 6, 12, 24, 48, 72, and 120 hpi. Asterisks indicate a significant difference (p < 0.05) from 0 hpi or hpt using Student’s t-test.

