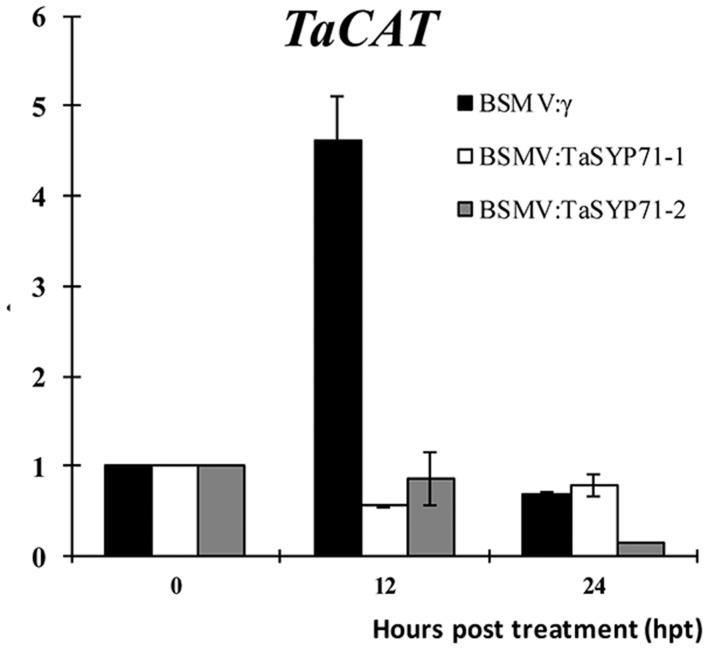
FIGURE 8.
The expression profiles of TaCAT was assessed 0, 12, and 24 h post 10 mM H2O2 treatment in TaSYP71 knockdown plants. The data were normalized to the wheat TaEF-1a expression level. The transcript levels of TaCAT at 0 hpt were set to one. Error bars represent variations among three independent replicates.

