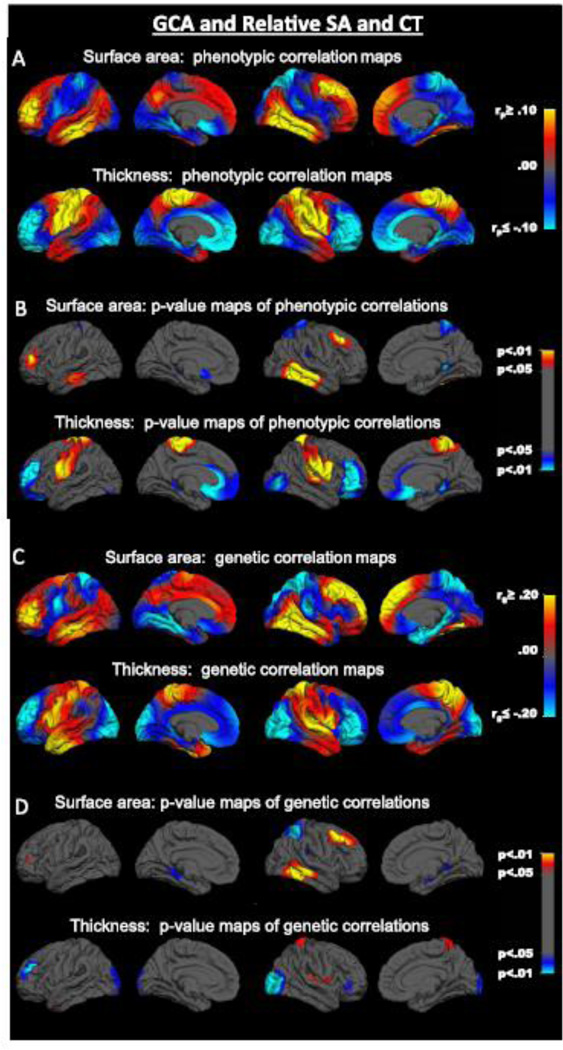
Fig. 3.
Vertex-wise maps of relative regional cortical surface area-GCA correlations (relative to total surface area) and relative regional cortical thickness-GCA correlations (relative to mean thickness). SA = surface area; CT = cortical thickness. Shown from left to right in each row are left lateral, left medial, right lateral, and right medial views.

