
Figure 1.
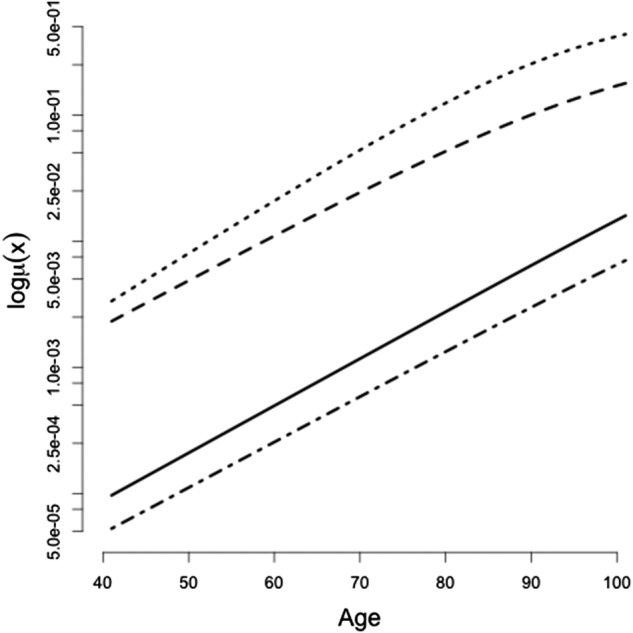
Mortality rates for two birth cohorts on a semilogarithmic plot. The estimates were based on the γ-Gompertz survival framework. Polish males in the general population (Cohort I, dotted; Cohort II, short dashed); Polish elite athletes (Cohort I, solid; Cohort II, alternating dashed lines). Cohort I representing year 1890 to 1919, and Cohort II from year 1920 to 1959.