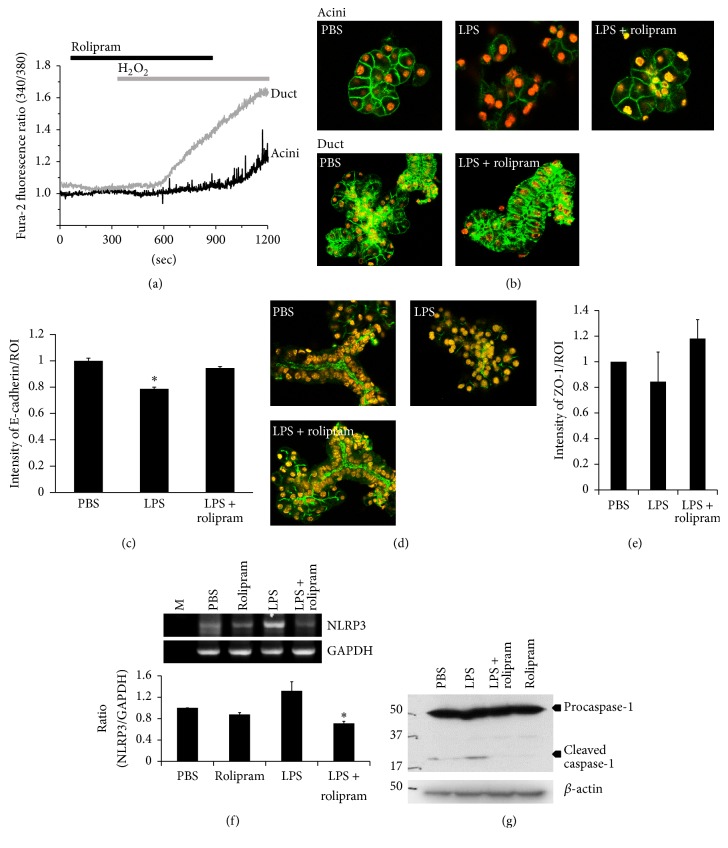
Figure 3.
Differential role of rolipram in SMG acinar and ductal cells. (a) Changes in [Ca2+]i induced by 10 μM H2O2 and pretreatment with 10 μg/mL rolipram in acinar (black trace) and ductal cells (gray trace). (b) Immunofluorescence staining patterns of E-cadherin protein (green) and DAPI staining (orange) of SMG acinar and ductal cells. The isolated SMG cells were treated with LPS in the absence or presence of rolipram for 1 hr. (c) Relative intensity of E-cadherin in plasma membrane (PM) fraction divided by the region of interest (ROI). The bars show the mean ± SEM (n = 3). (d) Immunofluorescence staining patterns of ZO-1 protein (green) and DAPI staining (orange) of SMG acinar and ductal clusters indicated experimental condition. (e) Relative intensity of ZO-1 divided by ROI. The bars show the mean ± SEM (n = 3). (f) mRNA expression of NLRP3 after the indicated stimulation for 30 min. Ratios are expressed as ratio of control and means ± SEMs are shown (n = 3, ∗ P < 0.01) compared with PBS. (g) Western blot analysis with caspase-1 after stimulation of indicated condition for 1 hr.

