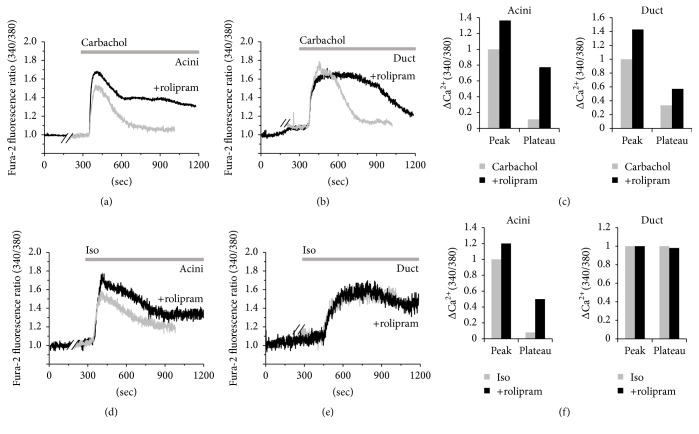
Figure 4.
Effect of rolipram on synergistic regulation of cholinergic and β-adrenergic stimulation in SMG cells. Changes in [Ca2+]i induced by 10 μM carbachol (gray trace) and pretreatment with 10 μg/mL rolipram (black trace) in SMG acinar (a) and ductal (b) cells. (c) Analysis of carbachol-induced maximum [Ca2+]i peak and plateau from baseline as determined using R340/380 fluorescence ratios in acini and ductal cells. Changes in [Ca2+]i induced by 100 μM isoproterenol (gray trace) and pretreatment with 10 μg/mL rolipram (black trace) in SMG acinar (d) and ductal (e) cells. All traces were averaged. (f) Analysis of isoproterenol-induced maximum [Ca2+]i peak and plateau from baseline as determined using R340/380 fluorescence ratios in acini and ductal cells. The upper bars indicate the extracellular solutions applied to the cells.

