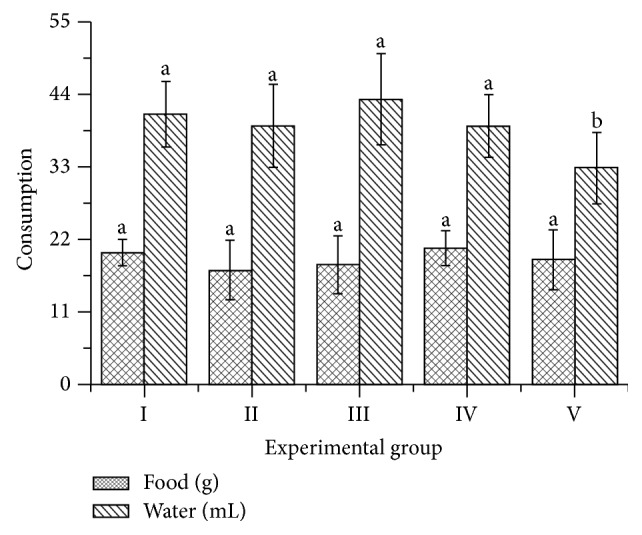
Figure 1.

Intake of water and foods for the animals during the experiment. I: control group; II: CCl4 induced hepatotoxicity group; III: Silymarin treated group; IV and V: Tamarindus indica L. tablets treated groups at doses 100 mg/kg and 200 mg/kg, respectively. Different letters on columns indicate significant statistical differences (Tukey HSD, p < 0.05).
